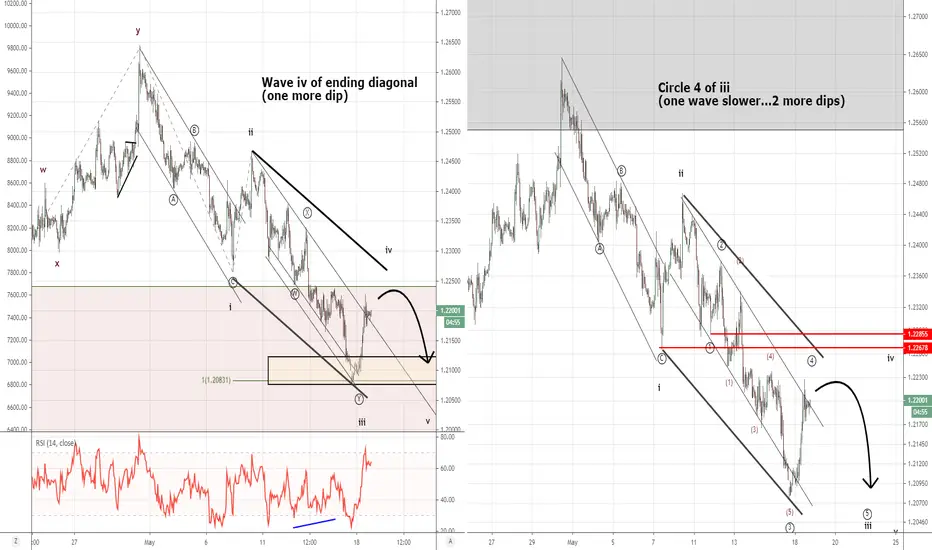
Chart on the left suggests we are in wave iv of C (ending diagonal)...one more dip lower to retest today's low to finish off the bearish sequence then we may see a strong rally.
The chart on the right is a more traditional impulse and is one wave slower...so two more dips lower to finish off C then a strong rally.
Trend lines support a hold below the April 7 low.
If you are learning Elliott Wave, I'd appreciate any questions you have so it makes sense for you.
Cheers!
Jeremy
Test your Elliott Wave readiness.
Free assessment + bonus training videos customized to your score:
qwiz.seethewaves.com/ewreadiness/p/tv1
Free assessment + bonus training videos customized to your score:
qwiz.seethewaves.com/ewreadiness/p/tv1
Disclaimer
The information and publications are not meant to be, and do not constitute, financial, investment, trading, or other types of advice or recommendations supplied or endorsed by TradingView. Read more in the Terms of Use.