Summary of Key Indicators for GBP/USD
Trend & Direction:
Directional Strength:
ADI is high (61.07) with PLUS_DI (26.11) far exceeding MINUS_DI (6.65) and a DX of 59.41—confirming a robust short-term bullish trend.
HT_TRENDMODE:
At 1.0, indicating an active trend.
Moving Averages & Price Forecast:
Core Levels:
EMA (1.31065), DEMA (1.31396), TEMA (1.31417), and TSF (1.31339) cluster between 1.310–1.314, suggesting the price is consolidating.
Resistance:
KAMA (1.31672) lies above the current range, hinting at a broader bearish bias.
Momentum & Oscillators:
RSI ~61: Indicates a moderately bullish stance.
MACD (0.0057) & CMO (21.96): Support upward momentum.
Stochastic (~59) & StochRSI (34): Signal energy without extreme overbought conditions.
CCI (195.50): Warns the market could be nearing overbought territory.
Price Range & Statistical Measures:
Central Price Range:
Prices mostly span from ~1.277 to 1.315.
Support & Resistance:
Short-term averages (EMA, DEMA, HT_TRENDLINE) near 1.277–1.282 suggest support, while longer-term filters (KAMA, TEMA) at 1.314–1.317 denote resistance.
Volatility:
ATR is very low in the short term (0.00037–0.0029) but climbs to ~0.0605 on longer timeframes—indicating time-dependent volatility.
Additional Forecast Tools & Volume:
Price regression tools (Linear Regression, TSF, TRIMA, T3, TEMA) consistently position prices within the 1.277–1.315 zone.
OBV and balance indicators reflect a near-balanced market on short terms, with some higher timeframe accumulation.
Price Action Overview:
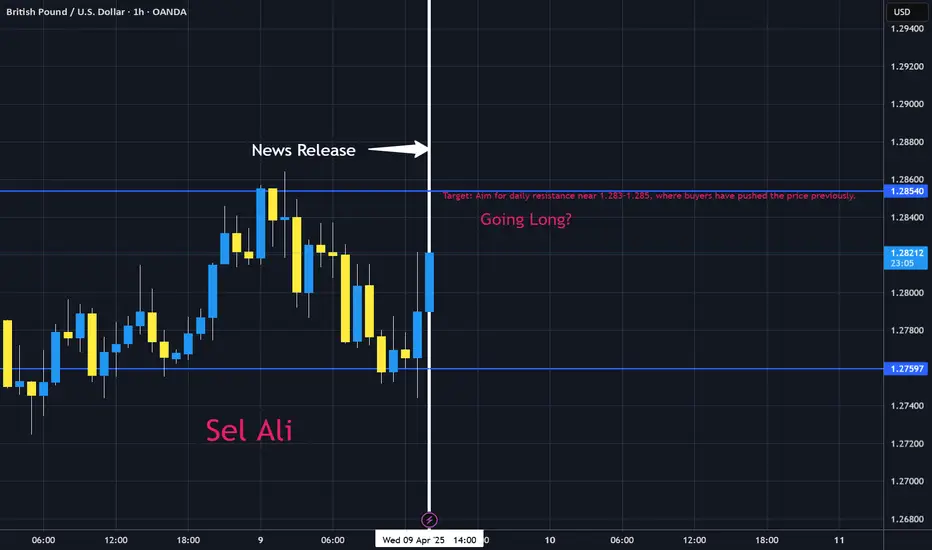
GBP/USD is trading in a tight consolidation around the lower end of its recent range—approximately 1.275–1.278. Recent candles indicate modest upward momentum with repeated tests of support, suggesting buyers are starting to step in near this level. However, the price remains near a key inflection point, and with pending high-impact news, a decisive breakout (or reversal) could occur once the market digests the upcoming data.
Current Setup & Trading Consideration:
The current price at 1.27584 is at the lower end of a crucial consolidation zone (1.275–1.278), favoring a potential bounce.
Waiting for confirmation on the daily chart (or a clear intraday reversal if you’re aggressive) can help reduce risk, particularly with upcoming news events.
As a daily chart trader, i'm less focused on shorter-term noise and more on the reversal or breakout confirmed by the daily candle. For me, It’s often best to let the daily close help confirm whether this near‐support level holds.
Trend & Direction:
Directional Strength:
ADI is high (61.07) with PLUS_DI (26.11) far exceeding MINUS_DI (6.65) and a DX of 59.41—confirming a robust short-term bullish trend.
HT_TRENDMODE:
At 1.0, indicating an active trend.
Moving Averages & Price Forecast:
Core Levels:
EMA (1.31065), DEMA (1.31396), TEMA (1.31417), and TSF (1.31339) cluster between 1.310–1.314, suggesting the price is consolidating.
Resistance:
KAMA (1.31672) lies above the current range, hinting at a broader bearish bias.
Momentum & Oscillators:
RSI ~61: Indicates a moderately bullish stance.
MACD (0.0057) & CMO (21.96): Support upward momentum.
Stochastic (~59) & StochRSI (34): Signal energy without extreme overbought conditions.
CCI (195.50): Warns the market could be nearing overbought territory.
Price Range & Statistical Measures:
Central Price Range:
Prices mostly span from ~1.277 to 1.315.
Support & Resistance:
Short-term averages (EMA, DEMA, HT_TRENDLINE) near 1.277–1.282 suggest support, while longer-term filters (KAMA, TEMA) at 1.314–1.317 denote resistance.
Volatility:
ATR is very low in the short term (0.00037–0.0029) but climbs to ~0.0605 on longer timeframes—indicating time-dependent volatility.
Additional Forecast Tools & Volume:
Price regression tools (Linear Regression, TSF, TRIMA, T3, TEMA) consistently position prices within the 1.277–1.315 zone.
OBV and balance indicators reflect a near-balanced market on short terms, with some higher timeframe accumulation.
Price Action Overview:
GBP/USD is trading in a tight consolidation around the lower end of its recent range—approximately 1.275–1.278. Recent candles indicate modest upward momentum with repeated tests of support, suggesting buyers are starting to step in near this level. However, the price remains near a key inflection point, and with pending high-impact news, a decisive breakout (or reversal) could occur once the market digests the upcoming data.
Current Setup & Trading Consideration:
The current price at 1.27584 is at the lower end of a crucial consolidation zone (1.275–1.278), favoring a potential bounce.
Waiting for confirmation on the daily chart (or a clear intraday reversal if you’re aggressive) can help reduce risk, particularly with upcoming news events.
As a daily chart trader, i'm less focused on shorter-term noise and more on the reversal or breakout confirmed by the daily candle. For me, It’s often best to let the daily close help confirm whether this near‐support level holds.
Note
and always, trade responsibly. Disclaimer
The information and publications are not meant to be, and do not constitute, financial, investment, trading, or other types of advice or recommendations supplied or endorsed by TradingView. Read more in the Terms of Use.
Disclaimer
The information and publications are not meant to be, and do not constitute, financial, investment, trading, or other types of advice or recommendations supplied or endorsed by TradingView. Read more in the Terms of Use.