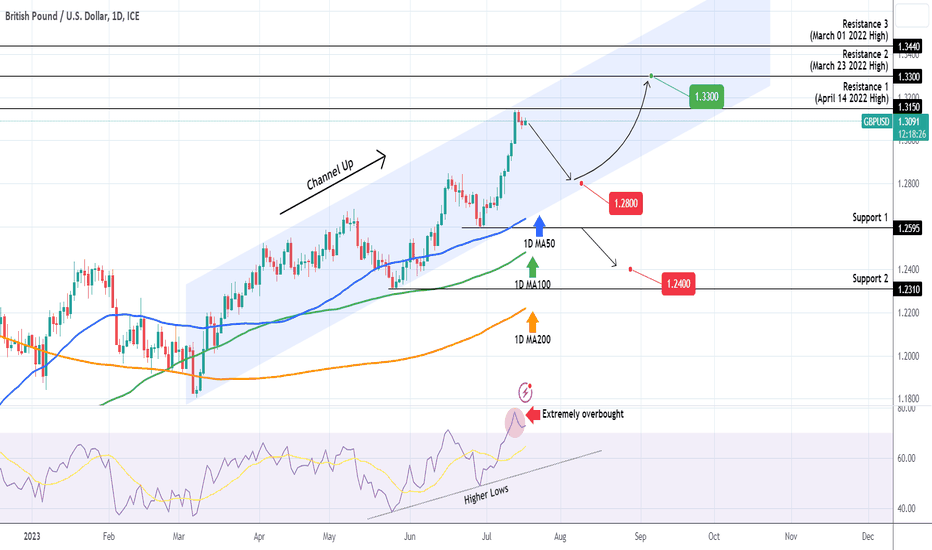
It has been almost 2 months since we last looked into the GBPUSD pair (see chart below), taking as sell position after the price was rejected on the Channel Up pattern's top:
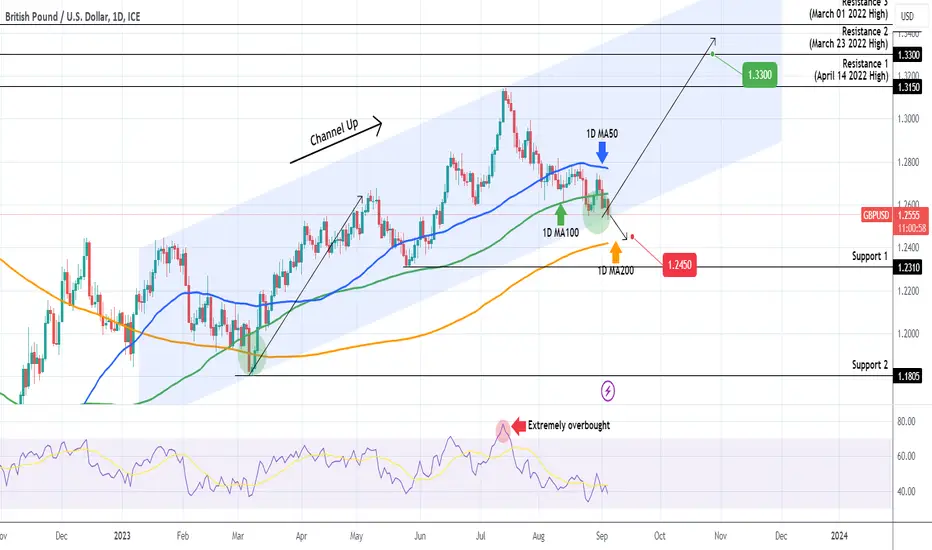
That Channel Up broke downwards, and the last such pattern to remain valid is the one shown on the current chart. The price is below the 1D MA100 (green trend-line) and today hit the bottom (Higher Lows trend-line) of the pattern. That is the exact pattern we saw on the March 08 bottom. The 1D MA50 (blue trend-line) is the short-term Resistance, which if broken, confirms the long-term bullish leg to a new Higher High.
Right now this is a buy signal, targeting at least 1.3300 (below Resistance 2) on the long-term. However, if a 1D candle closes below the Channel's bottom, you can also take a short-term sell position, targeting the 1D MA200 (orange trend-line) at 1.2450.
-------------------------------------------------------------------------------
** Please LIKE 👍, FOLLOW ✅, SHARE 🙌 and COMMENT ✍ if you enjoy this idea! Also share your ideas and charts in the comments section below! **
-------------------------------------------------------------------------------
💸💸💸💸💸💸
👇 👇 👇 👇 👇 👇
👑Best Signals (Forex/Crypto+70% accuracy) & Account Management (+20% profit/month on 10k accounts)
💰Free Channel t.me/tradingshotglobal
🤵Contact info@tradingshot.com t.me/tradingshot
🔥New service: next X100 crypto GEMS!
💰Free Channel t.me/tradingshotglobal
🤵Contact info@tradingshot.com t.me/tradingshot
🔥New service: next X100 crypto GEMS!
Disclaimer
The information and publications are not meant to be, and do not constitute, financial, investment, trading, or other types of advice or recommendations supplied or endorsed by TradingView. Read more in the Terms of Use.