💡 Idea:
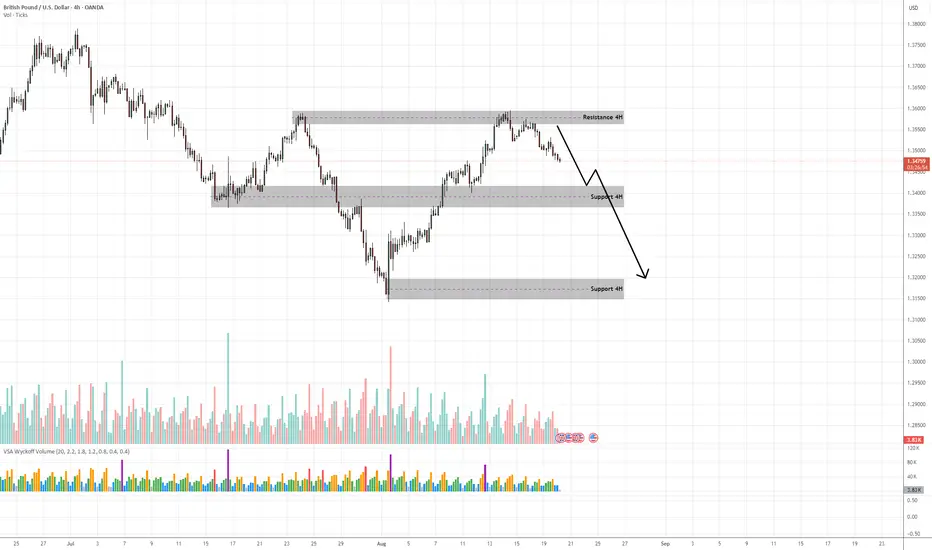
GBP/USD recently tested the 1.37–1.3750 resistance zone and showed clear supply signals in VSA terms. The price is rolling over with wide down-bars on increasing volume, confirming professional selling pressure. The pair is likely entering a markdown phase toward deeper 4H support levels.
📍 Trade Setup
Entry: 1.3470–1.3500 (pullback into broken support / minor supply test)
Stop Loss: 1.3575 (above last supply zone)
Target 1: 1.3340 (next 4H support)
Target 2: 1.3180 (major 4H support base)
R:R Ratio: ~1:3
📊 VSA & Technical Reasoning
Supply Bar at Resistance
At 1.37+, wide spread down-bars closed near the lows on ultra-high volume → classical VSA supply bar, confirming professional selling.
Upthrust / Trap Move
The wick above resistance acted as an Upthrust, luring breakout buyers before reversing sharply — a typical Wyckoff distribution signature.
No Demand Rally
Recent small up-bars into resistance came with narrow spread + low volume, showing lack of demand and confirming sellers are in control.
Lower Highs + Breakdown
Market structure has shifted into a downtrend sequence (lower highs & lower lows) aligning with VSA weakness.
Volume Confirmation
Volume on down-bars remains elevated vs. up-bars, validating that supply > demand. This suggests further downside continuation.
📌 Trading Plan
Look to short retracements into 1.3470–1.3500.
Expect price to break 1.34 support on increased supply.
Trail stop aggressively once 1.3340 is tested, targeting 1.3180 as the larger markdown objective.
Trade active
First Support is reached, once it is broken we will see a further drop in priceDisclaimer
The information and publications are not meant to be, and do not constitute, financial, investment, trading, or other types of advice or recommendations supplied or endorsed by TradingView. Read more in the Terms of Use.
Disclaimer
The information and publications are not meant to be, and do not constitute, financial, investment, trading, or other types of advice or recommendations supplied or endorsed by TradingView. Read more in the Terms of Use.