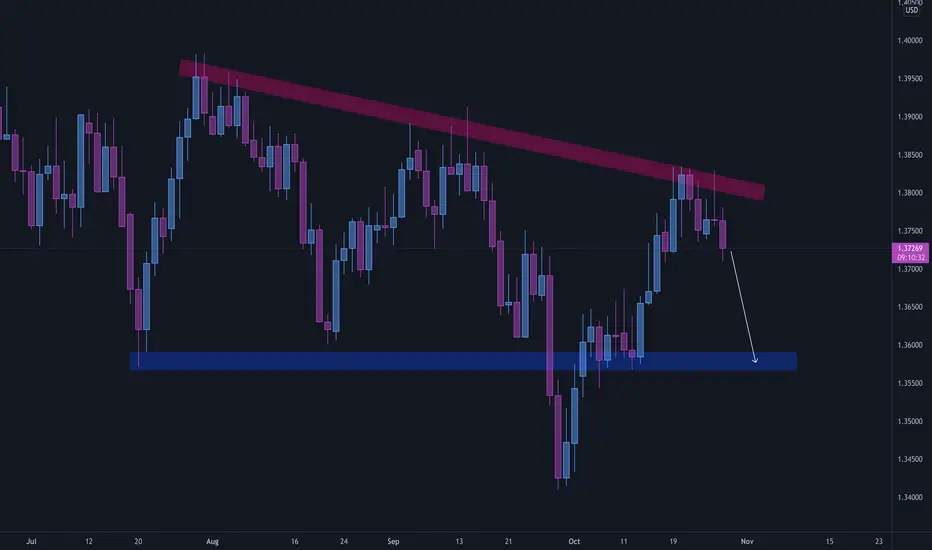
Looking at the DAILY timeframe chart, we can clearly see that the price has formed a beautiful descending triangle pattern and is currently located at the upper boundary of the pattern. We are now expecting for the price to keep dropping till it reaches the lower boundary of the triangle
Disclaimer
The information and publications are not meant to be, and do not constitute, financial, investment, trading, or other types of advice or recommendations supplied or endorsed by TradingView. Read more in the Terms of Use.
Disclaimer
The information and publications are not meant to be, and do not constitute, financial, investment, trading, or other types of advice or recommendations supplied or endorsed by TradingView. Read more in the Terms of Use.