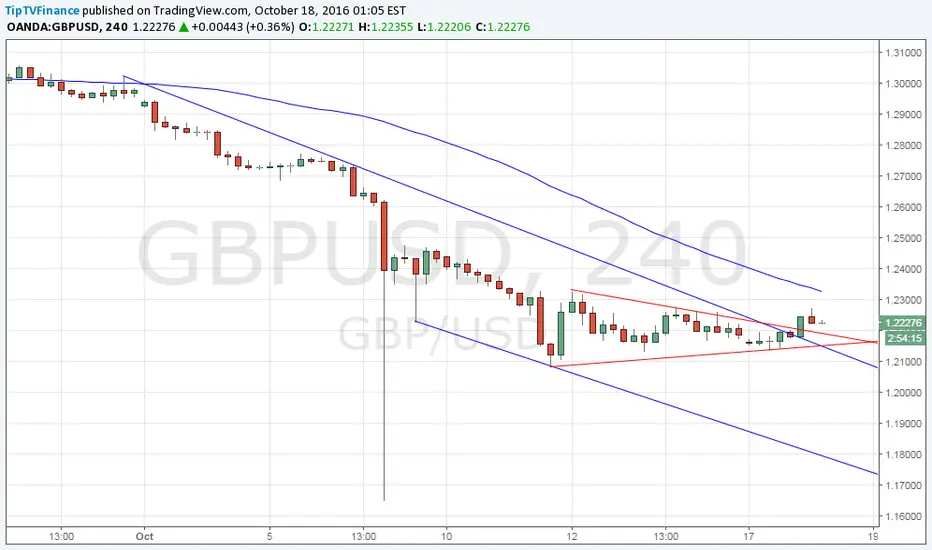
Pair’s bullish inverted hammer candle formation on the daily chart lst week followed by a bullish break from falling channel and symmetrical triangle formation on the 4-hr chart suggests the prices are likely to test and possibly breach the 4-hr 50-MA resistance seen today at 1.2327.
However, the 4-hr 50-MA is still sloping downwards; hence gains above 1.2327 should be viewed with caution.
On the lower side, break below 1.2149 (confluence of channel support and triangle support) would signal fresh sell-off towards 1.20 handle.
However, the 4-hr 50-MA is still sloping downwards; hence gains above 1.2327 should be viewed with caution.
On the lower side, break below 1.2149 (confluence of channel support and triangle support) would signal fresh sell-off towards 1.20 handle.
Disclaimer
The information and publications are not meant to be, and do not constitute, financial, investment, trading, or other types of advice or recommendations supplied or endorsed by TradingView. Read more in the Terms of Use.
Disclaimer
The information and publications are not meant to be, and do not constitute, financial, investment, trading, or other types of advice or recommendations supplied or endorsed by TradingView. Read more in the Terms of Use.