Trend & Structure:
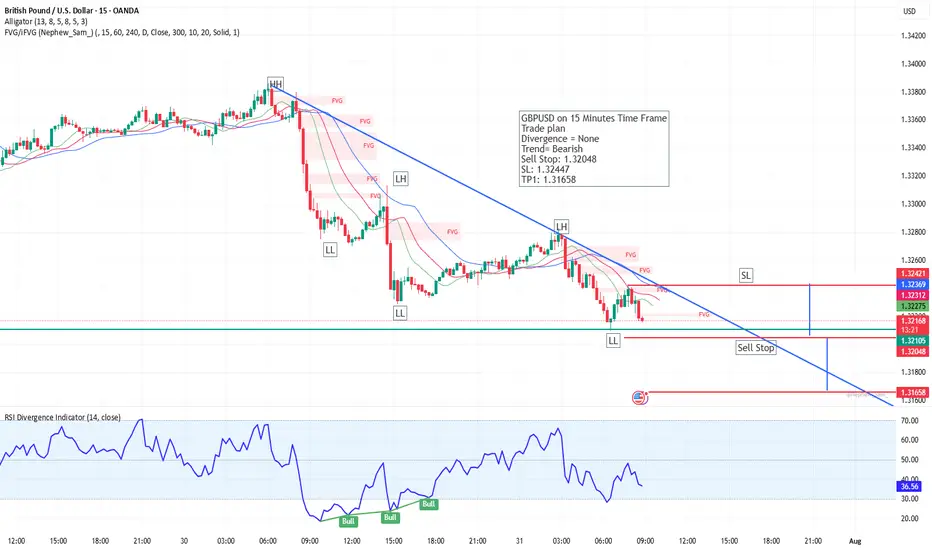
Overall Trend: Bearish, confirmed by the consistent series of Lower Highs (LH) and Lower Lows (LL).
Downtrend Line: A blue diagonal trendline is drawn connecting recent LHs, acting as dynamic resistance.
Indicators & Tools Used:
Alligator Indicator: Comprising three smoothed moving averages (13, 8, 5) – the lines are wide apart and aligned downward, confirming the downtrend.
Fair Value Gaps (FVG): Marked in red zones showing potential imbalances or inefficiencies in price action where price may return. Recent FVGs are appearing near LHs, implying selling pressure.
RSI Divergence Indicator (14, close):
Current RSI value: 37.72 → indicates bearish momentum.
Previous Bullish Divergences were marked on the RSI where price made lower lows but RSI made higher lows – however, these failed to reverse the downtrend sustainably.
Trade Plan (as per annotation on chart):
Setup: Sell Stop Entry
Entry Level: 1.32048
Stop Loss (SL): 1.32447 (above recent FVG and LH)
Take Profit 1 (TP1): 1.31658 (below last LL)
Rationale: Selling continuation in bearish trend structure without divergence on RSI, supported by trendline and fair value gaps.
Key Support/Resistance Zones:
Resistance Levels:
1.32441 (Stop Loss Zone / recent LH)
1.32386 and 1.32333 (Alligator and FVG overlap)
Support Zone:
1.31658 (TP1 and potential previous demand zone)
Conclusion:
This chart illustrates a trend-following sell setup in a clear bearish structure. The trader is planning to enter short upon a breakdown below 1.32048, anticipating a move toward 1.31658. The lack of current RSI divergence supports the momentum-based bearish continuation.
Disclaimer
The information and publications are not meant to be, and do not constitute, financial, investment, trading, or other types of advice or recommendations supplied or endorsed by TradingView. Read more in the Terms of Use.
Disclaimer
The information and publications are not meant to be, and do not constitute, financial, investment, trading, or other types of advice or recommendations supplied or endorsed by TradingView. Read more in the Terms of Use.