Hey guys,
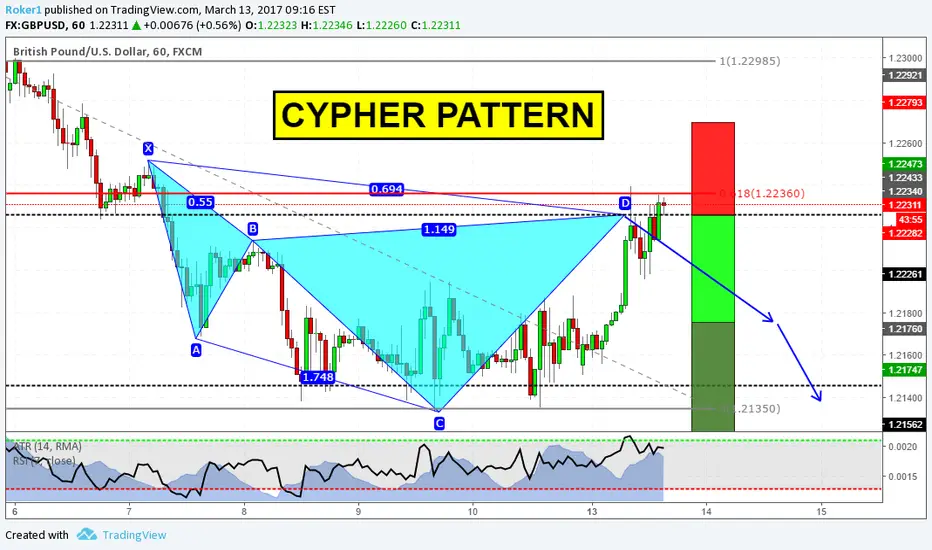
this is a Cypher formation that's already completed on the hourly chart. It's in accordance with the higher timeframe trend and so i'm going to use it as an entry reason for a trend continuation trade. The black line represents the previous support that's recently been broken and that could become resistance now.
Also, its completion lies right near the 618 retracement of the bigger impulse leg and the RSI has already gone in overbought terriotory.
First target at the 618 retracement of AD, and second target as an extension.
Stops above X.
If you have any question, feel free to comment below.
Otherwise, see you in the next chart.
Trade closed: target reached
First target hit! Stops to break even. Second position's running.Note
Target2 1,2102Trade closed: target reached
Out at breakeven!Related publications
Disclaimer
The information and publications are not meant to be, and do not constitute, financial, investment, trading, or other types of advice or recommendations supplied or endorsed by TradingView. Read more in the Terms of Use.
Related publications
Disclaimer
The information and publications are not meant to be, and do not constitute, financial, investment, trading, or other types of advice or recommendations supplied or endorsed by TradingView. Read more in the Terms of Use.