OVERVIEW:
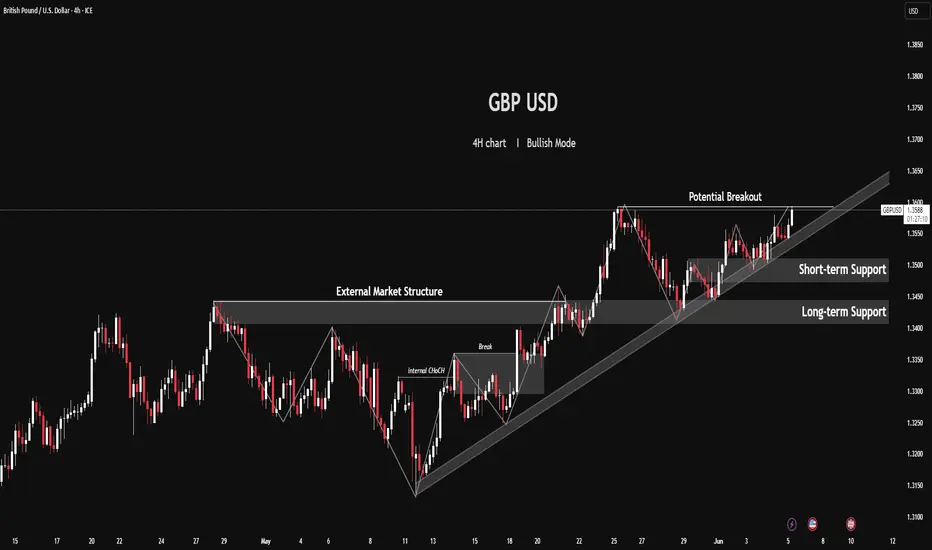
The GBP/USD pair has been in a clear bullish trend on the 4-hour timeframe since mid-May, demonstrating robust buying pressure. Price action indicates a significant shift in market structure, and we are currently observing a consolidation phase near a critical resistance level, suggesting potential for further upside.
KEY OBSERVATIONS & MARKET STRUCTURE:
1. Shift from Bearish/Consolidation to Bullish:
2. Confirmed Breakout & Retest:
POTENTIAL OUTLOOK & TRADE SCENARIOS:
1. Bullish Continuation (High-Probability):
2. Pullback and Bounce:
The GBP/USD pair has been in a clear bullish trend on the 4-hour timeframe since mid-May, demonstrating robust buying pressure. Price action indicates a significant shift in market structure, and we are currently observing a consolidation phase near a critical resistance level, suggesting potential for further upside.
KEY OBSERVATIONS & MARKET STRUCTURE:
1. Shift from Bearish/Consolidation to Bullish:
- Earlier in May, price was ranging with a slight bearish bias, failing to make significant higher highs.
- We can identify a key "External Market Structure" acting as strong resistance around the 1.3450 area.
- Prior to breaking this external structure, the chart highlights an "internal ChoCH" (Change of Character). This often signals an internal shift in order flow, indicating that buyers were be
ginning to gain control within the smaller timeframes, preceding the larger structural break.
2. Confirmed Breakout & Retest:
- Following the internal CHoCH, price executed a decisive "Break" above the significant "External Market Structure" around 1.3450.
- Crucially, after this break, price retraced and successfully retested this broken structure. This former resistance level has now flipped to become a strong "Long-term Support" area, validating the bullish market structure shift. This is a classic supply-to-demand flip.
- 3Current Ascending Price Channel & Support Levels:
- Since the retest of the long-term support, GBP/USD has been trending higher within a well-defined ascending channel or rising wedge formation.
- The lower boundary of this pattern is acting as "Short-term Support", consistently holding higher lows and guiding the price upwards. This dynamic support is currently around 1.3530-1.3550.
POTENTIAL OUTLOOK & TRADE SCENARIOS:
1. Bullish Continuation (High-Probability):
- Price is currently consolidating near a multi-day high, just below the upper boundary of the ascending channel, labeled as "Potential Breakout" around 1.3590-1.3600.
- A decisive break and close above this "Potential Breakout" level (ideally confirmed on the 4H or daily timeframe with strong bullish candles) would signal a continuation of the bullish momentum.
- Targets could be psychologically significant levels like 1.3650, 1.3700, and higher.
- For entry, look for a retest of the broken breakout level as new support after the initial surge.
2. Pullback and Bounce:
- Should the "Potential Breakout" level hold initially, we might see a pullback towards the "Short-term Support" trendline.
- A strong bounce off this short-term support would present a new buying opportunity, keeping the bullish bias intact within the established channel.
- Invalidation of Bullish Bias:
- A break below the "Short-term Support" trendline would be the first cautionary sign.
- However, the bullish mode would likely only be invalidated on a sustained break below the "Long-term Support" zone (the former External Market Structure) around 1.3450. A close below this level would suggest a deeper correction or a potential trend reversal.
CONCLUSION:
GBP/USD remains in a strong bullish posture, supported by a clear shift in market structure and consistent higher lows. The current consolidation near the 1.3600 handle presents a pivotal point. Traders should monitor for a definitive breakout to confirm further upside or a pullback to established support for continuation entries.
Risk Management is Paramount: Always use appropriate stop-loss orders and manage your position sizing according to your risk tolerance, especially when trading around potential breakout zones.
________________________________________
Disclaimer:
The information provided in this chart is for educational and informational purposes only and should not be considered as investment advice. Trading and investing involve substantial risk and are not suitable for every investor. You should carefully consider your financial situation and consult with a financial advisor before making any investment decisions. The creator of this chart does not guarantee any specific outcome or profit and is not responsible for any losses incurred as a result of using this information. Past performance is not indicative of future results. Use this information at your own risk. This chart has been created for my own improvement in Trading and Investment Analysis. Please do your own analysis before any investments.
Disclaimer
The information and publications are not meant to be, and do not constitute, financial, investment, trading, or other types of advice or recommendations supplied or endorsed by TradingView. Read more in the Terms of Use.
Disclaimer
The information and publications are not meant to be, and do not constitute, financial, investment, trading, or other types of advice or recommendations supplied or endorsed by TradingView. Read more in the Terms of Use.
