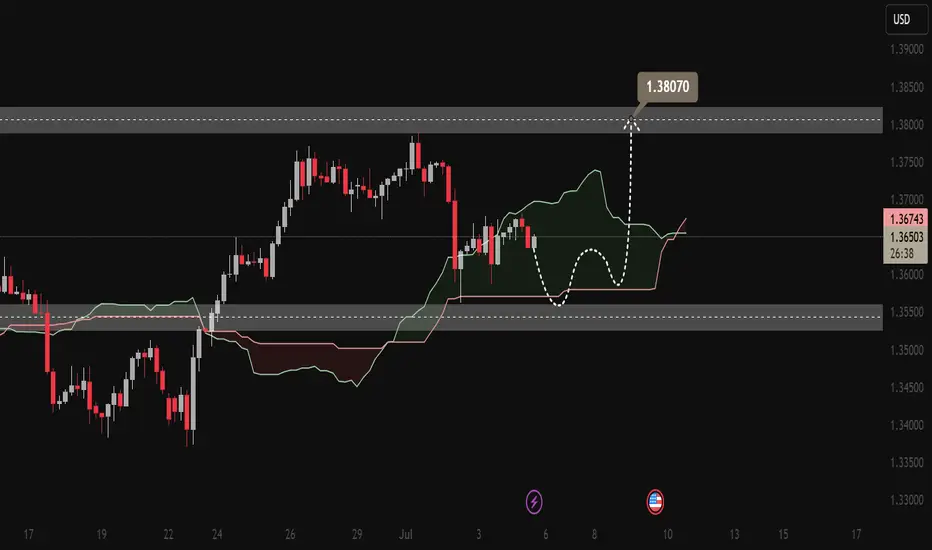
📊 GBP/USD Technical Analysis
Chart Timeframe: 4H
Date: July 4, 2025
Indicator Used: Ichimoku Cloud
Target Price Highlighted: 1.38070
🔍 Key Observations:
1. Support & Resistance Zones:
Resistance Zone: ~1.3800 - 1.3850 → A historically strong rejection area.
Support Zone: ~1.3530 - 1.3560 → Price previously bounced from here and re-tested.
2. Ichimoku Analysis:
Cloud (Kumo): Currently thin and flat, suggesting a period of consolidation and potential breakout.
Price Position: Price is within the Kumo, indicating indecision but leaning toward bullish bias.
Senkou Span A is flattening, while Span B is acting as a support base.
3. Bullish Path Projection:
The dotted white line suggests a retest of the lower cloud boundary, then a bounce to the upper resistance at 1.38070.
This projection aligns with a bullish reversal pattern from the lower support zone.
📈 Bullish Scenario:
Price dips into support (~1.3550), finds buying pressure, and breaks out of the Ichimoku cloud.
Confirmation of bullish momentum once price closes above 1.3700 and the cloud turns green with a bullish TK cross.
⚠️ Risk Factors:
If price breaks below 1.3550, the bullish setup becomes invalid.
A strong rejection from the top of the cloud (~1.3680–1.3700) could push price back down to the support range.
🧠 Conclusion:
The chart reflects a bullish setup in progress, but currently in a neutral consolidation phase inside the Ichimoku cloud. A clean break above the cloud with volume would signal momentum toward the 1.38070 target.
Forex Market Analyst | XAU/USD Specialist
. VIP Signal Channel for Premium Insights
. Comprehensive Forex Mentorship Program
. Affiliate Program for growth-driven partners
Join Our Telegram t.me/Goldsignalspro12
. VIP Signal Channel for Premium Insights
. Comprehensive Forex Mentorship Program
. Affiliate Program for growth-driven partners
Join Our Telegram t.me/Goldsignalspro12
Disclaimer
The information and publications are not meant to be, and do not constitute, financial, investment, trading, or other types of advice or recommendations supplied or endorsed by TradingView. Read more in the Terms of Use.
