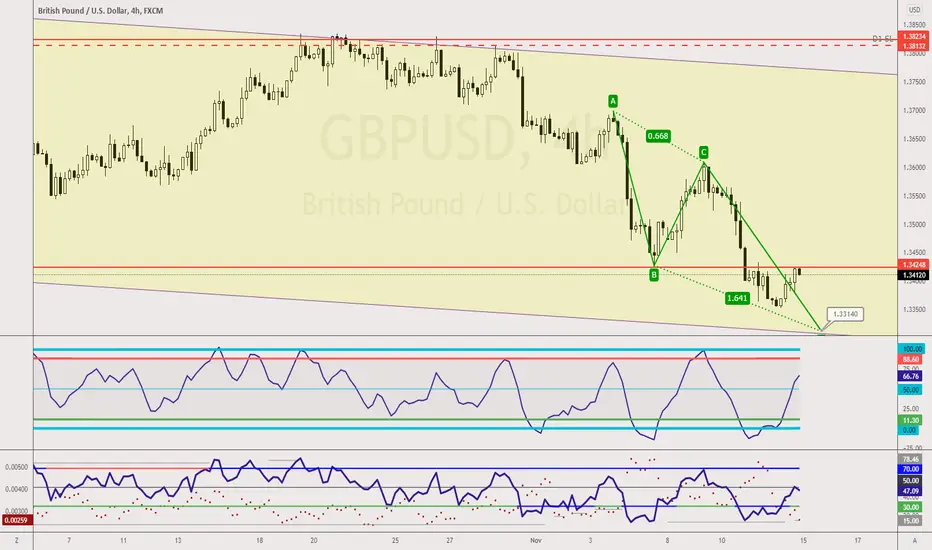
On the Daily Chart, GBPUSD has finally broken and closed below the support level and has been deemed Double Bottom, Mission Impossible. A key resistance level at 1.3428 works on all 3 major timeframes, namely the daily, the 4-hourly and the 1hourly chart.
You can wait for a double top setup on the 1-hourly chart the engage for a shorting opportunity.
If you are looking for a counter-trend trade, the ABCD pattern that forms at 1.3314 and if it happens to touch the bottom of the Bearish Parallel Channel would give you an advantage to long.
You can wait for a double top setup on the 1-hourly chart the engage for a shorting opportunity.
If you are looking for a counter-trend trade, the ABCD pattern that forms at 1.3314 and if it happens to touch the bottom of the Bearish Parallel Channel would give you an advantage to long.
🕒 15mins workday for Young Parents
🏦 Qualify Junior Analyst within 90days
🎤 Keynote Speaker
Get into our 15mins workday community
discord.gg/AKDr9vPqH7
Live session & Trading Tips on the GO
instagram.com/raynlim/
🏦 Qualify Junior Analyst within 90days
🎤 Keynote Speaker
Get into our 15mins workday community
discord.gg/AKDr9vPqH7
Live session & Trading Tips on the GO
instagram.com/raynlim/
Disclaimer
The information and publications are not meant to be, and do not constitute, financial, investment, trading, or other types of advice or recommendations supplied or endorsed by TradingView. Read more in the Terms of Use.