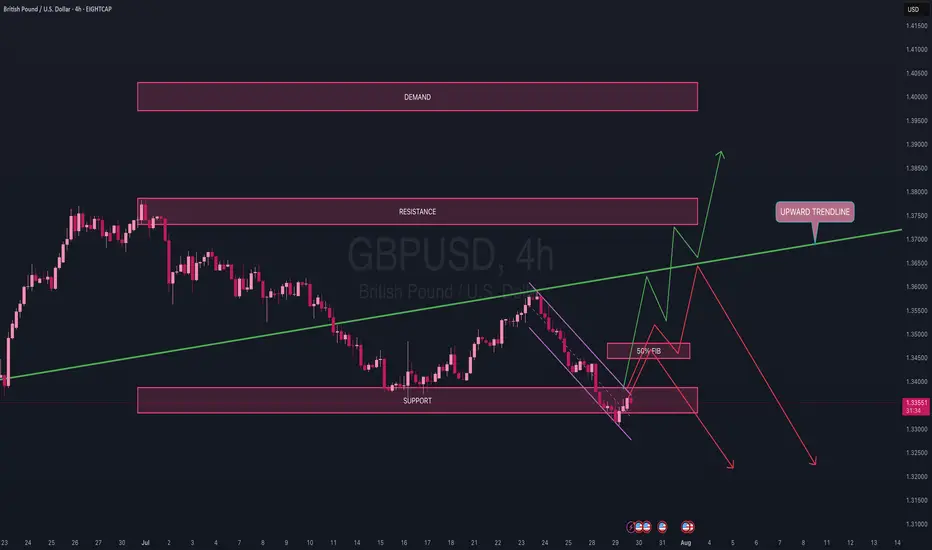
On the 4H timeframe, price recently bottomed out at the lower boundary of the channel and has since been hovering within a key support zone for the past couple of days.
My expectation is a potential push back up toward the 50% Fibonacci level of the most recent downward move, before a clearer decision is made. If we reach that level, it would satisfy all the criteria for a bearish flag formation, which could lead to a sudden move to the downside.
Alternatively, price may:
• Retest the ascending trendline before resuming the move down,
• Or break through that trendline, reclaiming bullish momentum back toward the resistance zone, and possibly into the demand area above.
For now, I’m waiting on clear confirmations before committing to a direction.
⚠️ Plenty of USD news on deck tomorrow, so stay patient.
Trade safe — only risk a maximum of 2% of your capital per day and don’t jump in without a solid setup.
Related publications
Disclaimer
The information and publications are not meant to be, and do not constitute, financial, investment, trading, or other types of advice or recommendations supplied or endorsed by TradingView. Read more in the Terms of Use.
Related publications
Disclaimer
The information and publications are not meant to be, and do not constitute, financial, investment, trading, or other types of advice or recommendations supplied or endorsed by TradingView. Read more in the Terms of Use.