Research Note: GBPZAR Technical Analysis
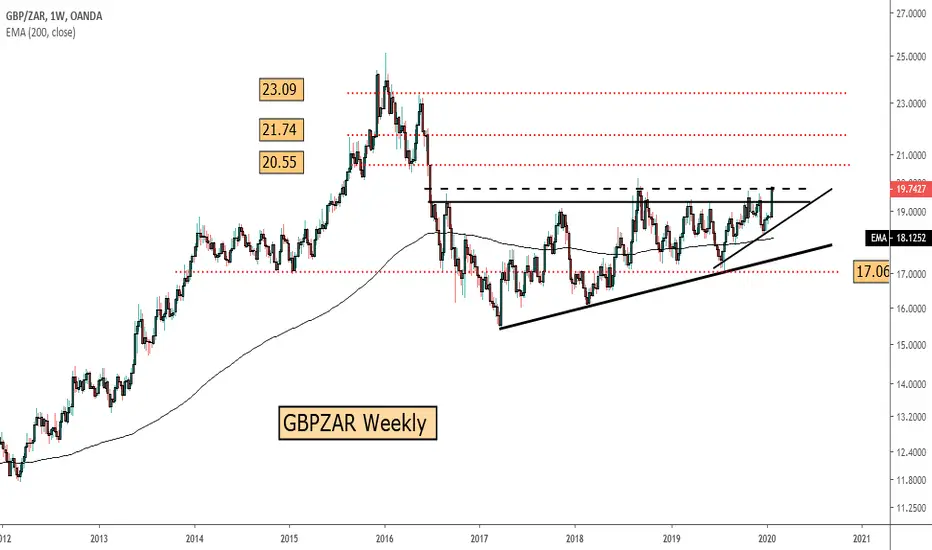
A review of the weekly chart of the British Pound versus the South African Rand sees key resistance levels being breached. Firstly the R19.31 overhead resistance that has held since June 2016 is being taken out while strong price action is currently being seen as R19.77 is being targeted by the bulls. A breach of these level open up R20.55, R21.74 and R23.09. It should also be noted that the price is starting shift away (to the upside) from the 200-week moving – this is also a key development. On the downside, a break below R17.06 changes the long term trajectory from bullish to bearish (i.e. weaker Pound, stronger Rand). For now though the long term trajectory is bullish (i.e. Strong Pound, weaker Rand).
A review of the weekly chart of the British Pound versus the South African Rand sees key resistance levels being breached. Firstly the R19.31 overhead resistance that has held since June 2016 is being taken out while strong price action is currently being seen as R19.77 is being targeted by the bulls. A breach of these level open up R20.55, R21.74 and R23.09. It should also be noted that the price is starting shift away (to the upside) from the 200-week moving – this is also a key development. On the downside, a break below R17.06 changes the long term trajectory from bullish to bearish (i.e. weaker Pound, stronger Rand). For now though the long term trajectory is bullish (i.e. Strong Pound, weaker Rand).
Disclaimer
The information and publications are not meant to be, and do not constitute, financial, investment, trading, or other types of advice or recommendations supplied or endorsed by TradingView. Read more in the Terms of Use.
Disclaimer
The information and publications are not meant to be, and do not constitute, financial, investment, trading, or other types of advice or recommendations supplied or endorsed by TradingView. Read more in the Terms of Use.
