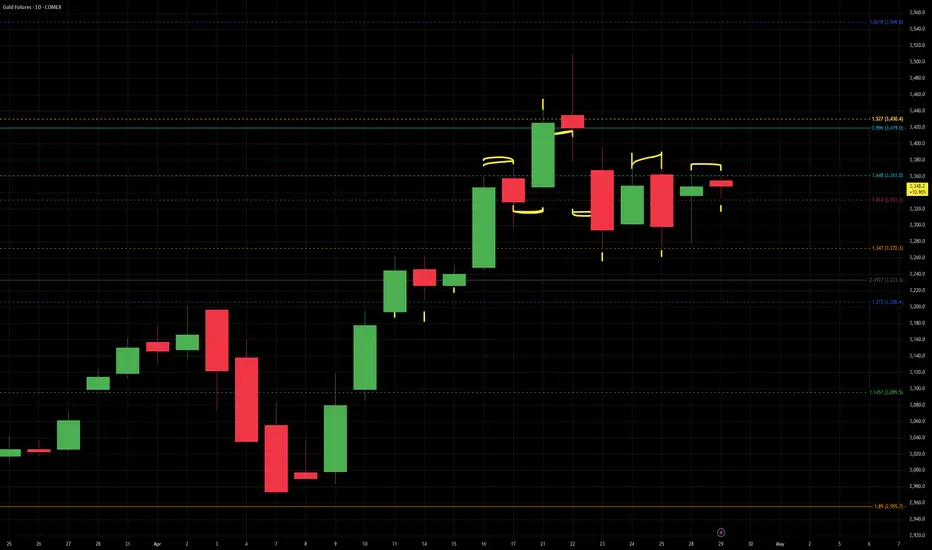
As you can see from the lower picture...I took two retrace peaks and traced the move with the fib tool and made the smaller one the solid line and the farther one the dashed line...
Kinda fits pretty neatly in those lines eh??
Not much more to say, make up what you think the move action will be, I just provide the lines...
And the numeration for those lines to be calculated is based off Pi and Fib percentages...so its not an actual default setting...can go into my other ideas where I actually give a table of all the numbers to enter in to achieve said result you see above and below...
Both Trend Fibs are with the reverse setting on...
-------

10 min
-------

1 day far
------
This Trend is with the reverse setting off: weekly overview:

and the closer daily...notice that 2000 quad peak:

and yet closer view...see that bottom line under the sideways consolidation is like almost the same as previous...:

finally the 10 min close up:

everything but the two arrows is the same from above...so you get a nice overall price consolidation with these lines...
Kinda fits pretty neatly in those lines eh??
Not much more to say, make up what you think the move action will be, I just provide the lines...
And the numeration for those lines to be calculated is based off Pi and Fib percentages...so its not an actual default setting...can go into my other ideas where I actually give a table of all the numbers to enter in to achieve said result you see above and below...
Both Trend Fibs are with the reverse setting on...
-------
10 min
-------
1 day far
------
This Trend is with the reverse setting off: weekly overview:
and the closer daily...notice that 2000 quad peak:
and yet closer view...see that bottom line under the sideways consolidation is like almost the same as previous...:
finally the 10 min close up:
everything but the two arrows is the same from above...so you get a nice overall price consolidation with these lines...
Note
The solid and dotted are the previous two trend fibs...the dashed is the new long term bull move + correction
Thoughts?
Note
The first is a daily Golden cat with a later rise in price after the correction.....but is the later a fractal Cat on the 10 min....
Maybe stretching a bit, but just interesting to see...may go the other way, but if its a fractal its pretty cool.
Disclaimer
The information and publications are not meant to be, and do not constitute, financial, investment, trading, or other types of advice or recommendations supplied or endorsed by TradingView. Read more in the Terms of Use.
Disclaimer
The information and publications are not meant to be, and do not constitute, financial, investment, trading, or other types of advice or recommendations supplied or endorsed by TradingView. Read more in the Terms of Use.