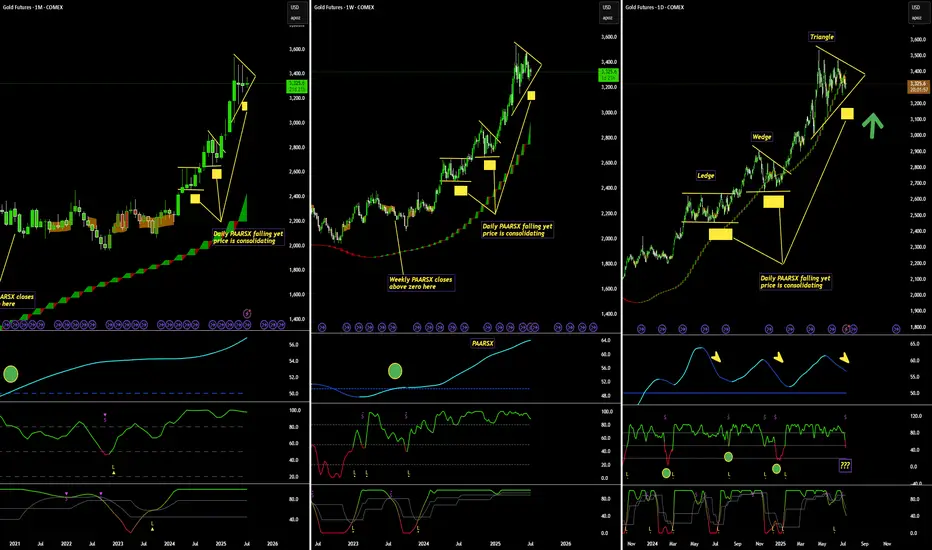
No surprise that bullish momentum is clearly evident on the Monthly & Weekly time frames with Higher timeframe hulls sloping on the M W D charts
What is interesting is how Loxx's PAARSX indicator, on the daily timeframe, clearly shows
a dark blue cycle downwards while price consolidates (yellow boxes under the price action)
providing us with hidden bullish divergence and another potential breakout very similar to the previous 2 ledge and wedge patterns.
Adaptive-Lookback Stochastic [Loxx] Top & Stochastic of Two-Pole SuperSmoother [Loxx]
Bottom show some solid daily historical entries. I can only imagine the 4 hour chart entries look just as profitable and enticing
This trader will be going long soon
Disclaimer
The information and publications are not meant to be, and do not constitute, financial, investment, trading, or other types of advice or recommendations supplied or endorsed by TradingView. Read more in the Terms of Use.
Disclaimer
The information and publications are not meant to be, and do not constitute, financial, investment, trading, or other types of advice or recommendations supplied or endorsed by TradingView. Read more in the Terms of Use.