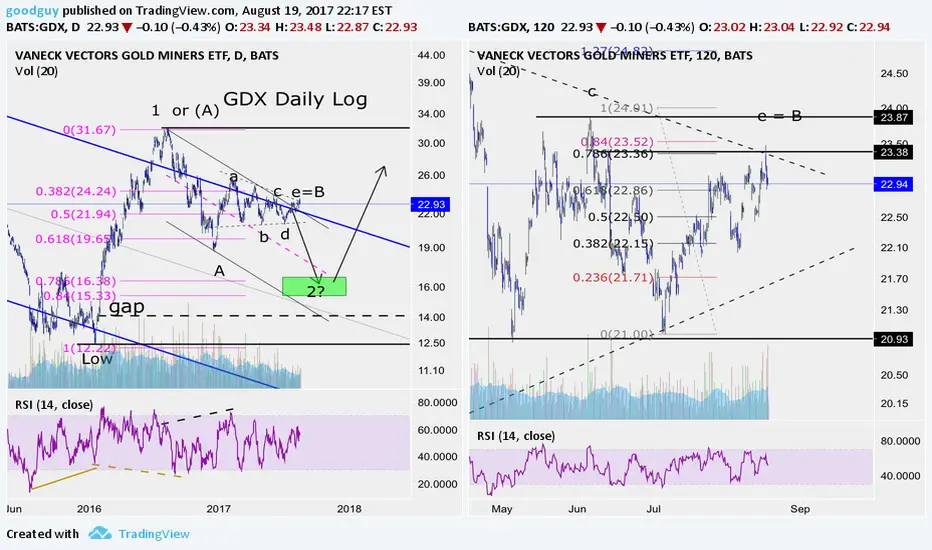
Although I am longer term bullish I am intermediate term bearish and short. I think the sideways triangle is very likely complete with wave "e" going to .78 of wave"c" then reversing intraday for a bearish engulfment candle for the day Would not be be surprised to see it open lower Monday then bounce to retest Friday's high but fail. If price goes above "c" then I'm wrong. Hope this will be helpful.
Trade active
Getting very close to moment of truth:Trade closed: stop reached
Related publications
Disclaimer
The information and publications are not meant to be, and do not constitute, financial, investment, trading, or other types of advice or recommendations supplied or endorsed by TradingView. Read more in the Terms of Use.
Related publications
Disclaimer
The information and publications are not meant to be, and do not constitute, financial, investment, trading, or other types of advice or recommendations supplied or endorsed by TradingView. Read more in the Terms of Use.