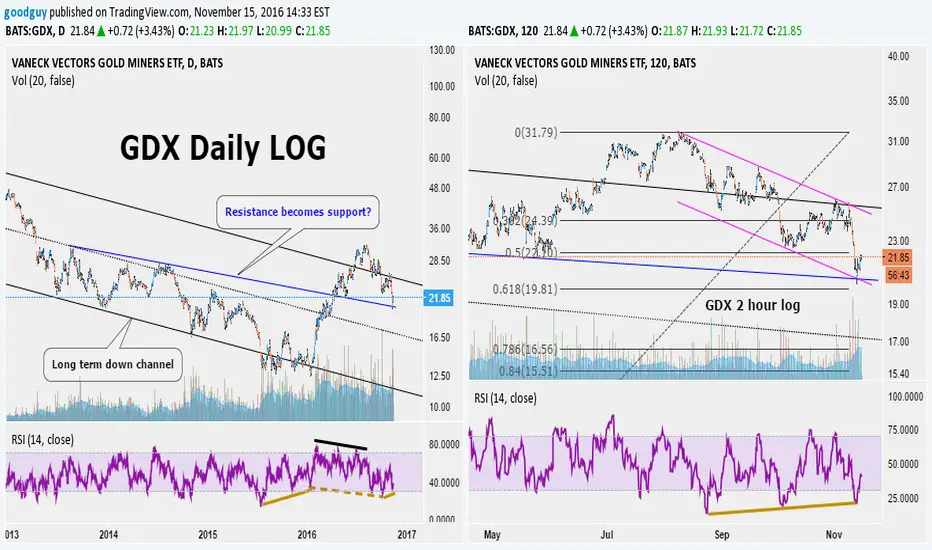
There has been a near .62 correction in the recent rise earlier this year (see 2 hour chart) and price appears to have bounced up off a potential "resistance becomes support" line. On the 2 hour chart the recent down action also has reached the downside of the channel. The daily RSI shows a positive reversal followed by a bullish divergence which as I have mentioned before often precedes a reversal.
Process through your own approach. Hope this is helpful. Feedback + or - always appreciated.
Process through your own approach. Hope this is helpful. Feedback + or - always appreciated.
Disclaimer
The information and publications are not meant to be, and do not constitute, financial, investment, trading, or other types of advice or recommendations supplied or endorsed by TradingView. Read more in the Terms of Use.
Disclaimer
The information and publications are not meant to be, and do not constitute, financial, investment, trading, or other types of advice or recommendations supplied or endorsed by TradingView. Read more in the Terms of Use.