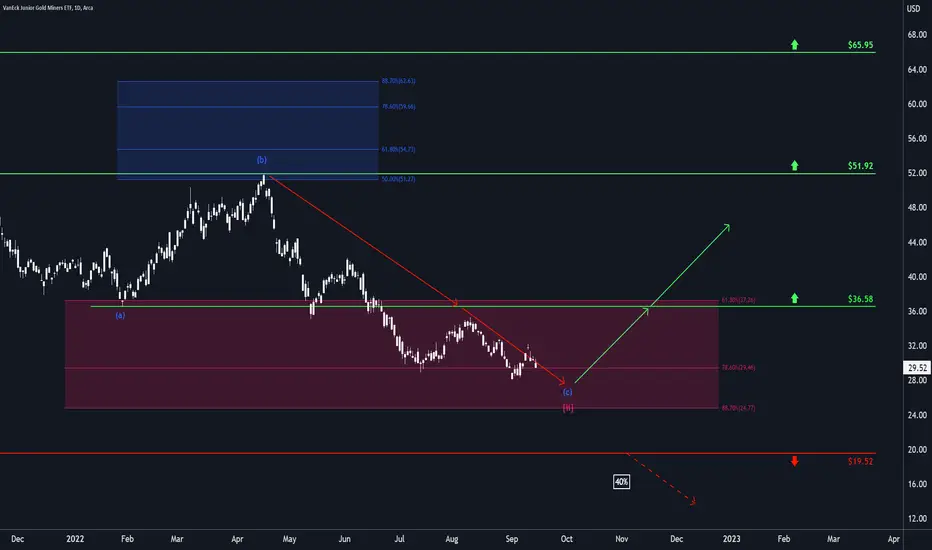
GDXJ is still hesitant to finally complete wave ii in magenta and is turning downwards again. As it can, of course, use the whole magenta colored zone between $37.26 and $24.77 to finish the overarching downwards movement, we give the ETF some more time to get its work done. However, as soon as wave ii in magenta is through, GDXJ should veer to the north, crossing the resistance at $36.58 and heading for the next at $51.92 from there. A 40% chance remains, though, that GDXJ could break through the magenta colored zone and drop below the support at $19.52, thus triggering further descent.
📊 Free daily market insights combining macro + Elliott Wave analysis
🚀 Spot trends early with momentum, sentiment & price structure
🌐 Join thousands trading smarter - full free analyses at dailymarketupdate.com
🚀 Spot trends early with momentum, sentiment & price structure
🌐 Join thousands trading smarter - full free analyses at dailymarketupdate.com
Related publications
Disclaimer
The information and publications are not meant to be, and do not constitute, financial, investment, trading, or other types of advice or recommendations supplied or endorsed by TradingView. Read more in the Terms of Use.