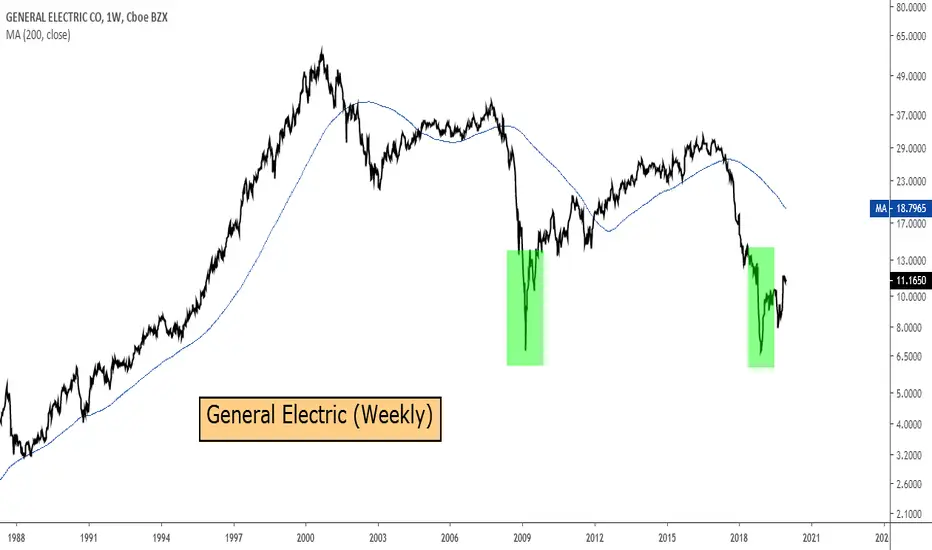
General Electric | From once being an industrial behemoth of the world, the trajectory of the GE share price is reflective of a major economic and market crisis – except we are not experiencing a crisis. A review of the weekly chart sees very similar price action as was the case during the 2008/2009 market crash when it fell by 80% from September 2007 to February 2009. At current levels, the recovery appears very similar to when we saw the share price rebounded off depressed levels and cleared it’s 40-week moving average. The Relative Strength Index has also made a 3 1/2-year high, reflecting the strength of the current move. When do traders/investors buy this name? On a pullback to the 40-week moving average. Current price: $11.34 / 40-week MA: $9.86.
Disclaimer
The information and publications are not meant to be, and do not constitute, financial, investment, trading, or other types of advice or recommendations supplied or endorsed by TradingView. Read more in the Terms of Use.
Disclaimer
The information and publications are not meant to be, and do not constitute, financial, investment, trading, or other types of advice or recommendations supplied or endorsed by TradingView. Read more in the Terms of Use.