Asset and Time frame -GE,4H
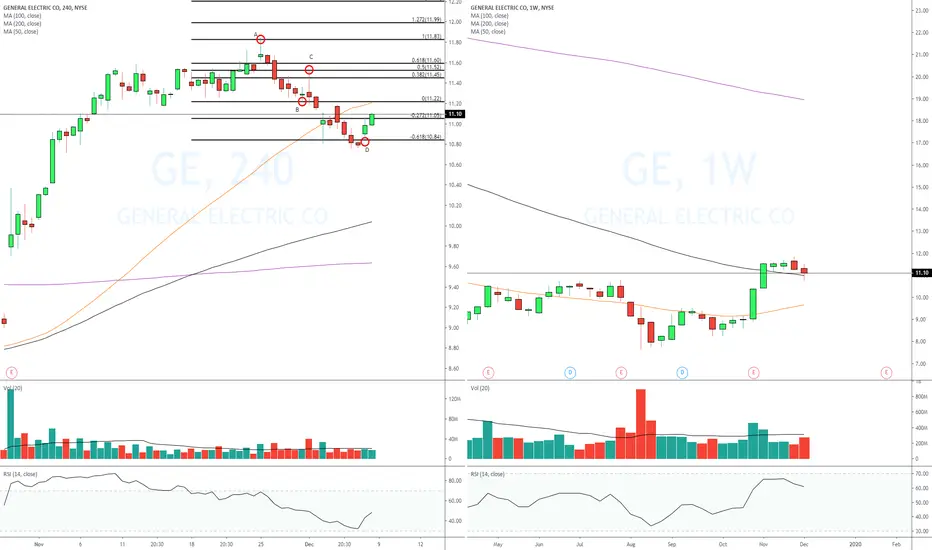
Entry Price -11.10
Exit(Stop Loss) -10.74
Exit(Take Profit) -11.96
The range between stop loss and entry - 0.86$
Technical Analysis -Daily chart is bullish, weekly chart just retested the 100 Daily SMA after making 2 Engulfing bullish candles,4H chart made a pullback and now made an ABCD pattern on the -61.8 Fibonacci level with a good reversal candles& volume.
What can be improved -
Conclusion & End of Trade -
Trade closed: target reached
Disclaimer
The information and publications are not meant to be, and do not constitute, financial, investment, trading, or other types of advice or recommendations supplied or endorsed by TradingView. Read more in the Terms of Use.
Disclaimer
The information and publications are not meant to be, and do not constitute, financial, investment, trading, or other types of advice or recommendations supplied or endorsed by TradingView. Read more in the Terms of Use.