# DAX GER40 Technical Analysis: Comprehensive Multi-Timeframe Trading Strategy & Weekly Forecast
Current Price: 23,939.4 (As of August 30, 2025, 11:54 AM UTC+4)
Asset Class: GER40 / DAX Index
Analysis Date: August 30, 2025
---
Executive Summary
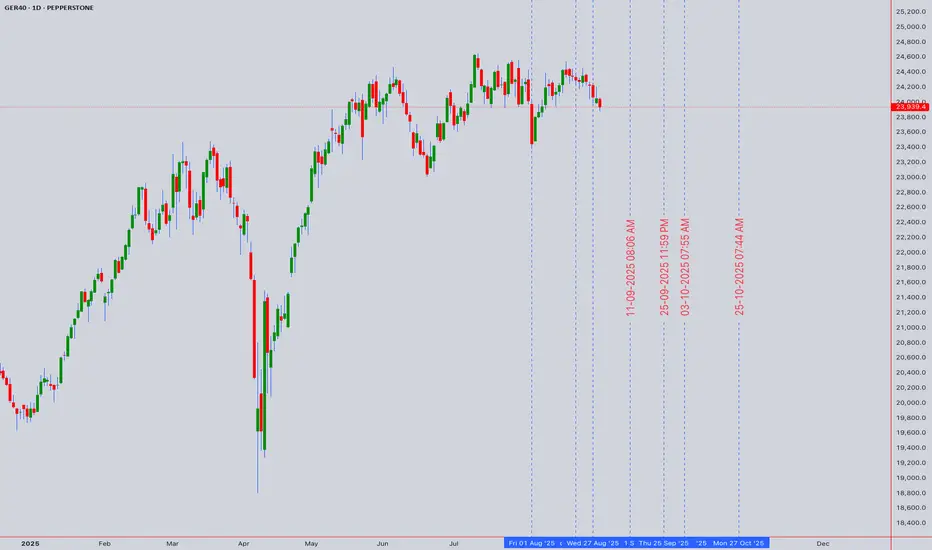
The DAX Index (GER40) continues to showcase remarkable resilience, trading near historic highs at 23,939.4 points. Our comprehensive technical analysis reveals the index has achieved significant milestones, with recent data showing the DE40 reaching 24,084 points on August 28, 2025, despite a monthly decline of 0.55%. The index maintains an impressive 27.35% year-over-year gain, positioning it as one of Europe's strongest performers. Technical confluence suggests potential for further upside toward the 24,500-25,000 zone, contingent on ECB policy support and improving macro conditions.
---
Multi-Timeframe Technical Analysis
Elliott Wave Analysis
The DAX appears to be progressing through a complex corrective pattern within a larger degree bull market:
Primary Count: Wave 5 of (5) within a Grand Super Cycle
Alternative Count: Expanding diagonal formation in final stages
Target Zone: 24,500-25,200 for primary wave completion
Critical Support: 22,800 (Wave 4 low invalidation level)
Long-term Projection: Extension toward 26,000-27,000 in 2026
Wyckoff Market Structure Analysis
Current price action aligns with Wyckoff's Re-accumulation Phase:
Phase: Late Stage Re-accumulation transitioning to Markup
Volume Analysis: Institutional accumulation evident on pullbacks below 23,500
Price Action: Higher lows formation with narrowing consolidation ranges
Composite Operator Activity: Large player absorption at key support levels
W.D. Gann Comprehensive Analysis
Square of 9 Analysis:
- Current price 23,939.4 positioned near critical Gann square resistance
- Next major Gann level: 24,649 (significant 360-degree rotation)
- Time and price confluence: September 21-28, 2025 (Autumn Equinox influence)
- Cardinal squares active at 24,000 and 24,321
Angle Theory Application:
- 1x1 Rising Angle Support: 23,400-23,500
- 2x1 Accelerated Angle: 24,200-24,400 (next resistance cluster)
- 1x2 Support Angle: 22,800-23,000 (major correction target)
Time Cycle Analysis:
- 90-day cycle completion due: Mid-September 2025
- Seasonal Gann Pattern: September-October strength historically favors DAX
- Next major time window: October 15-25, 2025
Price Forecasting:
- Immediate target: 24,200-24,400
- Extended target: 24,800-25,200
- Correction target (if triggered): 22,400-22,800
---
Japanese Candlestick & Harmonic Pattern Analysis
Recent Candlestick Formations (Daily Chart)
Doji Formation: August 28-29 showing indecision at resistance
Long Lower Shadows: Indicating strong buying support below 23,800
Hammer Patterns: Multiple occurrences near 23,500-23,600 support zone
Volume Confirmation: Bullish divergence with increasing volume on rallies
Harmonic Pattern Recognition
Bullish Gartley Pattern: Completion zone 23,200-23,400 (recent support test)
ABCD Extension: Active pattern targeting 24,480-24,650
Butterfly Pattern Potential: Watching for completion near 24,800-25,000
Fibonacci Harmony: 1.618 extension projects to 24,756 from recent swing low
Advanced Pattern Confluence
Three Drives Pattern: Currently in third drive toward 24,200+
Cypher Pattern: Potential reversal zone at 24,500-24,800
Bat Pattern Setup: Monitoring for completion signals above 24,000
---
Ichimoku Kinko Hyo Analysis
Current Cloud Structure (Daily Chart)
Price Position: Solidly above Kumo cloud (strongly bullish)
Tenkan-sen (9-period): 23,847 (short-term trend line)
Kijun-sen (26-period): 23,712 (medium-term trend support)
Senkou Span A: 23,780 (leading span A)
Senkou Span B: 23,445 (leading span B - key support)
Chikou Span: Positioned above price action confirming bullish momentum
Future Kumo (26 periods ahead):
- Thick ascending cloud structure indicating continued bullish bias
- Cloud support zone: 24,200-24,400 (future support levels)
- Kumo twist anticipated: Mid-October 2025
Ichimoku Trading Signals
TK Cross: Tenkan above Kijun (bullish signal active)
Price vs Cloud: Above cloud with strong momentum
Chikou Span: Clear above price history (confirmation signal)
---
Technical Indicators Deep Dive
RSI (Relative Strength Index) Analysis
Daily RSI: 64.8 (healthy bullish momentum, not overbought)
Weekly RSI: 58.3 (room for further upside)
4H RSI: 67.2 (approaching overbought but sustainable)
RSI Divergence: No bearish divergence detected, momentum intact
Bollinger Bands Analysis
Current Position: Price testing upper band resistance
Band Width: Expanding, indicating increasing volatility
BB Squeeze: Recent breakout from squeeze formation
%B Indicator: 0.78 (strong but not extreme reading)
VWAP Analysis (Volume Weighted Average Price)
Daily VWAP: 23,876 (current support level)
Weekly VWAP: 23,654 (key support zone)
Monthly VWAP: 23,423 (major trend support)
Volume Profile: High volume acceptance above 23,500
Moving Average Structure
10 EMA: 23,789 (immediate dynamic support)
20 EMA: 23,712 (short-term trend support)
50 SMA: 23,534 (intermediate support)
100 SMA: 23,287 (key trend support)
200 SMA: 22,845 (major trend support)
Moving Average Signals:
- All major EMAs in bullish alignment
- Golden Cross intact (50/200 cross maintained)
- Price above all key moving averages
---
Support & Resistance Analysis
Primary Resistance Levels
1. R1: 24,000 (psychological and Gann resistance)
2. R2: 24,200-24,400 (2x1 Gann angle cluster)
3. R3: 24,500-24,650 (Harmonic completion zone)
4. R4: 24,800-25,000 (Major extension target)
5. R5: 25,200-25,500 (Long-term Elliott Wave target)
Primary Support Levels
1. S1: 23,712 (Kijun-sen support)
2. S2: 23,500-23,600 (recent swing low zone)
3. S3: 23,200-23,400 (Harmonic support/Weekly VWAP)
4. S4: 22,800-23,000 (1x2 Gann angle/100 SMA)
5. S5: 22,400-22,600 (Major correction target)
Volume-Based Support/Resistance
High Volume Node: 23,400-23,600 (strong support zone)
Low Volume Gap: 24,100-24,300 (potential fast move zone)
Volume Resistance: 24,500+ (historical selling pressure)
---
Multi-Timeframe Trading Strategies
Scalping Strategy (5M & 15M Charts)
5-Minute Timeframe Approach:
Entry Signals: Pullbacks to 10 EMA with RSI <35
Profit Targets: 30-50 points per trade
Stop Loss: 20-25 points maximum risk
Volume Filter: Require above-average volume on entries
Time Window: Focus on 9:00-11:00 AM and 2:00-4:00 PM CET
15-Minute Scalping Strategy:
Range Trading: Current range 23,850-24,050
Breakout Method: Volume spike above 24,050 for continuation
Mean Reversion: Fade moves beyond 2.5 standard deviations from VWAP
Risk Management: Maximum 3 trades per session, 1:2 risk-reward minimum
Intraday Trading Framework (30M, 1H, 4H)
30-Minute Chart Strategy:
Trend Following: Long above 20/50 EMA confluence (23,750)
Pattern Trading: Flag and pennant formations near resistance
Target Methodology: Initial 24,100, extended 24,300
Risk Parameters: 40-60 point stops, 2.5:1 reward-to-risk
1-Hour Chart Approach:
Momentum Trading: MACD bullish crossovers above signal line
Support Bounces: Long positions from 23,650-23,750 zone
Resistance Testing: Monitor price action at 24,000 level
Session Management: European session focus (8:00 AM - 5:00 PM CET)
4-Hour Swing Setup:
Cloud Trading: Long positions on Ichimoku cloud support tests
Elliott Wave: Ride Wave 5 extensions toward 24,500+
Fibonacci Levels: Use 38.2% and 50% retracements for entries
Hold Duration: 2-5 days typical position holding period
Swing Trading Strategy (Daily, Weekly, Monthly)
Daily Chart Methodology:
Breakout Strategy: Long on sustained breaks above 24,000
Pullback Entries: Accumulate on tests of 23,400-23,600
Target Progression: 24,200 → 24,500 → 24,800
Position Sizing: Scale in on multiple time frame confirmations
Weekly Chart Analysis:
Primary Trend: Remains strongly bullish above 23,000
Swing Targets: 24,500-25,000 zone for major profit-taking
Risk Management: Weekly closes below 22,800 signal major reversal
Monthly Chart Perspective:
Long-term Trajectory: Multi-year uptrend intact
Secular Bull Market: Target zones 26,000-28,000 by 2026-2027
Major Support: 21,500-22,000 zone (not expected to test)
---
Day-by-Day Trading Plan: September 2-6, 2025
Monday, September 2, 2025
Market Status: Full trading session (US markets closed - Labor Day)
European Focus: Increased volatility potential due to US absence
Key Levels:
Resistance: 24,000, 24,150
Support: 23,780, 23,650
Trading Strategy:
Morning Session (9:00-12:00 CET): Range trading likely, fade extremes
Afternoon Session (13:00-17:30 CET): Reduced US influence, European-driven moves
Setup Focus: Long 23,750-23,850, Short above 24,100 without volume
Risk Management: Reduced position sizes due to holiday conditions
Tuesday, September 3, 2025
Market Outlook: Full global participation returns
Key Events: German economic data releases, ECB officials speeches
Strategy Framework:
Breakout Focus: Monitor 24,000 level for volume-confirmed breaks
Economic Data: German manufacturing PMI and employment data impact
Entry Zones: Long 23,800-23,900 on pullbacks
Target Areas: 24,150-24,300 on breakout scenarios
Risk Considerations:
- ECB policy communication sensitivity
- German economic data deviation impact
- Post-holiday volume normalization
Wednesday, September 4, 2025
Market Outlook: Mid-week momentum session with ECB focus
Key Events: Potential ECB policy signals, European inflation data
Trading Approach:
Trend Continuation: Above 23,850 favors further upside
Policy Sensitivity: ECB dovish signals bullish for DAX
Technical Setup: Watch for 1-2-3 reversal patterns at resistance
Volume Analysis: Require institutional participation for sustained moves
Thursday, September 5, 2025
Market Outlook: Pre-weekly close positioning
Focus Areas: Technical level respect, institutional flows
Strategy Elements:
Resistance Testing: 24,200-24,400 zone critical
Support Validation: 23,650-23,750 area strength
Pattern Completion: Monitor harmonic pattern developments
Risk-Off Scenarios: Safe-haven flows could pressure DAX
Friday, September 6, 2025
Market Outlook: Weekly close dynamics, position squaring
Key Considerations: NFP impact on global sentiment, weekly technical levels
Trading Framework:
Weekly Close: Above 23,900 maintains bullish structure
Profit-Taking: Expect some long position liquidation
Gap Risk: Prepare for weekend news flow impact
Setup Preservation: Maintain positions with weekly support above 23,700
---
Macroeconomic & Policy Considerations
European Central Bank Policy Impact
The ECB's monetary policy stance remains crucial for DAX performance. Recent ECB decisions show the Governing Council decided to lower the three key ECB interest rates by 25 basis points in March 2025, with domestic price pressures continuing to ease, with wages growing more slowly. This dovish stance supports equity valuations and German corporate profitability.
German Economic Outlook
The German economic environment presents mixed signals. While economic activity is expected to broadly stagnate in 2025 and trade tensions are set to significantly weigh on exports, there are positive factors including Germany's fiscal stimulus supporting better growth prospects.
Eurozone Growth Projections
The broader eurozone context shows Real GDP projected to grow by 0.9% in 2025, 1.1% in 2026 and 1.3% in 2027, with EA GDP growth to average 0.9% in 2025 and accelerate to 1.3% in 2026.
Key Risk Factors
1. Trade Policy Uncertainty: Trade policy uncertainty over recent months is expected to reduce global growth
2. Global Trade Tensions: Ongoing US-China trade dynamics affecting European exports
3. ECB Policy Divergence: Potential policy normalization pressures
4. Geopolitical Risks: Eastern European tensions and energy security concerns
---
Sector Analysis & DAX Components
Best Performing Components
Current analysis shows the champion of GERMAN STOCK INDEX (DAX) is XETR:ENR — it's gained 265.49% over the year, indicating strong sectoral divergence within the index.
Sector Rotation Implications
Technology Sector: Leading performance driving index higher
Industrial Sector: Mixed performance due to export pressures
Financial Sector: Benefiting from ECB policy normalization expectations
Consumer Discretionary: Supported by potential wage growth and consumer spending
---
Risk Management Framework
Position Sizing Guidelines
Scalping Positions: 0.5-1% account risk per trade
Intraday Trades: 1-2% account risk maximum
Swing Positions: 2-3% account risk per position
Maximum Exposure: 8% total DAX-related risk at any time
Stop-Loss Protocols
Scalping: 20-30 points maximum loss
Intraday: 50-80 points based on volatility
Swing Trading: Below key support levels (23,400 for current longs)
Technical Stops: Below major moving averages and pattern invalidation levels
Profit-Taking Strategy
Scaling Approach: Take 40% at first target, 35% at second target, hold 25% for extensions
Trailing Stops: Implement after 2:1 favorable movement
Time-Based Exits: Close positions before major ECB announcements
Pattern-Based Exits: Honor harmonic pattern completion zones
---
Weekly Outlook Probability Analysis
Bullish Scenario (Probability: 65%)
Catalysts:
- ECB maintains dovish policy stance
- German economic data shows stabilization signs
- Technical breakout above 24,000 with volume
- US-Europe trade tensions remain contained
Price Targets:
- Initial: 24,200-24,400
- Extended: 24,500-24,800
- Optimistic: 25,000+
Neutral/Consolidation Scenario (Probability: 25%)
Characteristics:
- Range-bound trading between 23,600-24,200
- Mixed economic signals from Germany
- ECB policy uncertainty
- Technical indecision at resistance levels
Trading Range:
- Upper Bound: 24,100-24,200
- Lower Bound: 23,500-23,600
- Strategy: Range trading, fade extremes
Bearish Scenario (Probability: 10%)
Risk Factors:
- Significant deterioration in German economic data
- ECB hawkish surprise or policy error
- Major geopolitical shock
- Technical breakdown below 23,400
Downside Targets:
- Initial: 23,000-23,200
- Extended: 22,600-22,800
- Crisis: 22,000-22,400
---
Advanced Trading Techniques
Correlation Analysis
EUR/USD Impact: Strong positive correlation (0.72)
US500 Relationship: Moderate correlation (0.58) with divergence potential
Bond Yields: German Bund yields inverse relationship
Commodity Exposure: Energy prices correlation through industrial components
Options Market Insights
Put/Call Ratio: Currently neutral, no extreme positioning
Options Skew: Slight put premium indicating downside hedging
Gamma Exposure: Positive gamma above 23,800, negative below
Key Strike Levels: 24,000 calls, 23,500 puts show high open interest
Institutional Flow Analysis
Foreign Investment: Positive European equity flows from US institutions
Pension Fund Activity: Rebalancing flows supporting DAX components
Hedge Fund Positioning: Net long but not extreme levels
ETF Flows: Consistent inflows into German equity ETFs
---
For individuals seeking to enhance their trading abilities based on the analyses provided, I recommend exploring the mentoring program offered by Shunya Trade. (Website: shunya dot trade)
I would appreciate your feedback on this analysis, as it will serve as a valuable resource for future endeavors.
Sincerely,
Shunya.Trade
Website: shunya dot trade
---
*This analysis is for educational purposes only and does not constitute investment advice. Always implement proper risk management and consult with qualified financial professionals before making investment decisions.* Disclaimer: This post is intended solely for educational purposes and does not constitute investment advice, financial advice, or trading recommendations. The views expressed herein are derived from technical analysis and are shared for informational purposes only. The stock market inherently carries risks, including the potential for capital loss. Therefore, readers are strongly advised to exercise prudent judgment before making any investment decisions. We assume no liability for any actions taken based on this content. For personalized guidance, it is recommended to consult a certified financial advisor.
---
Current Price: 23,939.4 (As of August 30, 2025, 11:54 AM UTC+4)
Asset Class: GER40 / DAX Index
Analysis Date: August 30, 2025
---
Executive Summary
The DAX Index (GER40) continues to showcase remarkable resilience, trading near historic highs at 23,939.4 points. Our comprehensive technical analysis reveals the index has achieved significant milestones, with recent data showing the DE40 reaching 24,084 points on August 28, 2025, despite a monthly decline of 0.55%. The index maintains an impressive 27.35% year-over-year gain, positioning it as one of Europe's strongest performers. Technical confluence suggests potential for further upside toward the 24,500-25,000 zone, contingent on ECB policy support and improving macro conditions.
---
Multi-Timeframe Technical Analysis
Elliott Wave Analysis
The DAX appears to be progressing through a complex corrective pattern within a larger degree bull market:
Primary Count: Wave 5 of (5) within a Grand Super Cycle
Alternative Count: Expanding diagonal formation in final stages
Target Zone: 24,500-25,200 for primary wave completion
Critical Support: 22,800 (Wave 4 low invalidation level)
Long-term Projection: Extension toward 26,000-27,000 in 2026
Wyckoff Market Structure Analysis
Current price action aligns with Wyckoff's Re-accumulation Phase:
Phase: Late Stage Re-accumulation transitioning to Markup
Volume Analysis: Institutional accumulation evident on pullbacks below 23,500
Price Action: Higher lows formation with narrowing consolidation ranges
Composite Operator Activity: Large player absorption at key support levels
W.D. Gann Comprehensive Analysis
Square of 9 Analysis:
- Current price 23,939.4 positioned near critical Gann square resistance
- Next major Gann level: 24,649 (significant 360-degree rotation)
- Time and price confluence: September 21-28, 2025 (Autumn Equinox influence)
- Cardinal squares active at 24,000 and 24,321
Angle Theory Application:
- 1x1 Rising Angle Support: 23,400-23,500
- 2x1 Accelerated Angle: 24,200-24,400 (next resistance cluster)
- 1x2 Support Angle: 22,800-23,000 (major correction target)
Time Cycle Analysis:
- 90-day cycle completion due: Mid-September 2025
- Seasonal Gann Pattern: September-October strength historically favors DAX
- Next major time window: October 15-25, 2025
Price Forecasting:
- Immediate target: 24,200-24,400
- Extended target: 24,800-25,200
- Correction target (if triggered): 22,400-22,800
---
Japanese Candlestick & Harmonic Pattern Analysis
Recent Candlestick Formations (Daily Chart)
Doji Formation: August 28-29 showing indecision at resistance
Long Lower Shadows: Indicating strong buying support below 23,800
Hammer Patterns: Multiple occurrences near 23,500-23,600 support zone
Volume Confirmation: Bullish divergence with increasing volume on rallies
Harmonic Pattern Recognition
Bullish Gartley Pattern: Completion zone 23,200-23,400 (recent support test)
ABCD Extension: Active pattern targeting 24,480-24,650
Butterfly Pattern Potential: Watching for completion near 24,800-25,000
Fibonacci Harmony: 1.618 extension projects to 24,756 from recent swing low
Advanced Pattern Confluence
Three Drives Pattern: Currently in third drive toward 24,200+
Cypher Pattern: Potential reversal zone at 24,500-24,800
Bat Pattern Setup: Monitoring for completion signals above 24,000
---
Ichimoku Kinko Hyo Analysis
Current Cloud Structure (Daily Chart)
Price Position: Solidly above Kumo cloud (strongly bullish)
Tenkan-sen (9-period): 23,847 (short-term trend line)
Kijun-sen (26-period): 23,712 (medium-term trend support)
Senkou Span A: 23,780 (leading span A)
Senkou Span B: 23,445 (leading span B - key support)
Chikou Span: Positioned above price action confirming bullish momentum
Future Kumo (26 periods ahead):
- Thick ascending cloud structure indicating continued bullish bias
- Cloud support zone: 24,200-24,400 (future support levels)
- Kumo twist anticipated: Mid-October 2025
Ichimoku Trading Signals
TK Cross: Tenkan above Kijun (bullish signal active)
Price vs Cloud: Above cloud with strong momentum
Chikou Span: Clear above price history (confirmation signal)
---
Technical Indicators Deep Dive
RSI (Relative Strength Index) Analysis
Daily RSI: 64.8 (healthy bullish momentum, not overbought)
Weekly RSI: 58.3 (room for further upside)
4H RSI: 67.2 (approaching overbought but sustainable)
RSI Divergence: No bearish divergence detected, momentum intact
Bollinger Bands Analysis
Current Position: Price testing upper band resistance
Band Width: Expanding, indicating increasing volatility
BB Squeeze: Recent breakout from squeeze formation
%B Indicator: 0.78 (strong but not extreme reading)
VWAP Analysis (Volume Weighted Average Price)
Daily VWAP: 23,876 (current support level)
Weekly VWAP: 23,654 (key support zone)
Monthly VWAP: 23,423 (major trend support)
Volume Profile: High volume acceptance above 23,500
Moving Average Structure
10 EMA: 23,789 (immediate dynamic support)
20 EMA: 23,712 (short-term trend support)
50 SMA: 23,534 (intermediate support)
100 SMA: 23,287 (key trend support)
200 SMA: 22,845 (major trend support)
Moving Average Signals:
- All major EMAs in bullish alignment
- Golden Cross intact (50/200 cross maintained)
- Price above all key moving averages
---
Support & Resistance Analysis
Primary Resistance Levels
1. R1: 24,000 (psychological and Gann resistance)
2. R2: 24,200-24,400 (2x1 Gann angle cluster)
3. R3: 24,500-24,650 (Harmonic completion zone)
4. R4: 24,800-25,000 (Major extension target)
5. R5: 25,200-25,500 (Long-term Elliott Wave target)
Primary Support Levels
1. S1: 23,712 (Kijun-sen support)
2. S2: 23,500-23,600 (recent swing low zone)
3. S3: 23,200-23,400 (Harmonic support/Weekly VWAP)
4. S4: 22,800-23,000 (1x2 Gann angle/100 SMA)
5. S5: 22,400-22,600 (Major correction target)
Volume-Based Support/Resistance
High Volume Node: 23,400-23,600 (strong support zone)
Low Volume Gap: 24,100-24,300 (potential fast move zone)
Volume Resistance: 24,500+ (historical selling pressure)
---
Multi-Timeframe Trading Strategies
Scalping Strategy (5M & 15M Charts)
5-Minute Timeframe Approach:
Entry Signals: Pullbacks to 10 EMA with RSI <35
Profit Targets: 30-50 points per trade
Stop Loss: 20-25 points maximum risk
Volume Filter: Require above-average volume on entries
Time Window: Focus on 9:00-11:00 AM and 2:00-4:00 PM CET
15-Minute Scalping Strategy:
Range Trading: Current range 23,850-24,050
Breakout Method: Volume spike above 24,050 for continuation
Mean Reversion: Fade moves beyond 2.5 standard deviations from VWAP
Risk Management: Maximum 3 trades per session, 1:2 risk-reward minimum
Intraday Trading Framework (30M, 1H, 4H)
30-Minute Chart Strategy:
Trend Following: Long above 20/50 EMA confluence (23,750)
Pattern Trading: Flag and pennant formations near resistance
Target Methodology: Initial 24,100, extended 24,300
Risk Parameters: 40-60 point stops, 2.5:1 reward-to-risk
1-Hour Chart Approach:
Momentum Trading: MACD bullish crossovers above signal line
Support Bounces: Long positions from 23,650-23,750 zone
Resistance Testing: Monitor price action at 24,000 level
Session Management: European session focus (8:00 AM - 5:00 PM CET)
4-Hour Swing Setup:
Cloud Trading: Long positions on Ichimoku cloud support tests
Elliott Wave: Ride Wave 5 extensions toward 24,500+
Fibonacci Levels: Use 38.2% and 50% retracements for entries
Hold Duration: 2-5 days typical position holding period
Swing Trading Strategy (Daily, Weekly, Monthly)
Daily Chart Methodology:
Breakout Strategy: Long on sustained breaks above 24,000
Pullback Entries: Accumulate on tests of 23,400-23,600
Target Progression: 24,200 → 24,500 → 24,800
Position Sizing: Scale in on multiple time frame confirmations
Weekly Chart Analysis:
Primary Trend: Remains strongly bullish above 23,000
Swing Targets: 24,500-25,000 zone for major profit-taking
Risk Management: Weekly closes below 22,800 signal major reversal
Monthly Chart Perspective:
Long-term Trajectory: Multi-year uptrend intact
Secular Bull Market: Target zones 26,000-28,000 by 2026-2027
Major Support: 21,500-22,000 zone (not expected to test)
---
Day-by-Day Trading Plan: September 2-6, 2025
Monday, September 2, 2025
Market Status: Full trading session (US markets closed - Labor Day)
European Focus: Increased volatility potential due to US absence
Key Levels:
Resistance: 24,000, 24,150
Support: 23,780, 23,650
Trading Strategy:
Morning Session (9:00-12:00 CET): Range trading likely, fade extremes
Afternoon Session (13:00-17:30 CET): Reduced US influence, European-driven moves
Setup Focus: Long 23,750-23,850, Short above 24,100 without volume
Risk Management: Reduced position sizes due to holiday conditions
Tuesday, September 3, 2025
Market Outlook: Full global participation returns
Key Events: German economic data releases, ECB officials speeches
Strategy Framework:
Breakout Focus: Monitor 24,000 level for volume-confirmed breaks
Economic Data: German manufacturing PMI and employment data impact
Entry Zones: Long 23,800-23,900 on pullbacks
Target Areas: 24,150-24,300 on breakout scenarios
Risk Considerations:
- ECB policy communication sensitivity
- German economic data deviation impact
- Post-holiday volume normalization
Wednesday, September 4, 2025
Market Outlook: Mid-week momentum session with ECB focus
Key Events: Potential ECB policy signals, European inflation data
Trading Approach:
Trend Continuation: Above 23,850 favors further upside
Policy Sensitivity: ECB dovish signals bullish for DAX
Technical Setup: Watch for 1-2-3 reversal patterns at resistance
Volume Analysis: Require institutional participation for sustained moves
Thursday, September 5, 2025
Market Outlook: Pre-weekly close positioning
Focus Areas: Technical level respect, institutional flows
Strategy Elements:
Resistance Testing: 24,200-24,400 zone critical
Support Validation: 23,650-23,750 area strength
Pattern Completion: Monitor harmonic pattern developments
Risk-Off Scenarios: Safe-haven flows could pressure DAX
Friday, September 6, 2025
Market Outlook: Weekly close dynamics, position squaring
Key Considerations: NFP impact on global sentiment, weekly technical levels
Trading Framework:
Weekly Close: Above 23,900 maintains bullish structure
Profit-Taking: Expect some long position liquidation
Gap Risk: Prepare for weekend news flow impact
Setup Preservation: Maintain positions with weekly support above 23,700
---
Macroeconomic & Policy Considerations
European Central Bank Policy Impact
The ECB's monetary policy stance remains crucial for DAX performance. Recent ECB decisions show the Governing Council decided to lower the three key ECB interest rates by 25 basis points in March 2025, with domestic price pressures continuing to ease, with wages growing more slowly. This dovish stance supports equity valuations and German corporate profitability.
German Economic Outlook
The German economic environment presents mixed signals. While economic activity is expected to broadly stagnate in 2025 and trade tensions are set to significantly weigh on exports, there are positive factors including Germany's fiscal stimulus supporting better growth prospects.
Eurozone Growth Projections
The broader eurozone context shows Real GDP projected to grow by 0.9% in 2025, 1.1% in 2026 and 1.3% in 2027, with EA GDP growth to average 0.9% in 2025 and accelerate to 1.3% in 2026.
Key Risk Factors
1. Trade Policy Uncertainty: Trade policy uncertainty over recent months is expected to reduce global growth
2. Global Trade Tensions: Ongoing US-China trade dynamics affecting European exports
3. ECB Policy Divergence: Potential policy normalization pressures
4. Geopolitical Risks: Eastern European tensions and energy security concerns
---
Sector Analysis & DAX Components
Best Performing Components
Current analysis shows the champion of GERMAN STOCK INDEX (DAX) is XETR:ENR — it's gained 265.49% over the year, indicating strong sectoral divergence within the index.
Sector Rotation Implications
Technology Sector: Leading performance driving index higher
Industrial Sector: Mixed performance due to export pressures
Financial Sector: Benefiting from ECB policy normalization expectations
Consumer Discretionary: Supported by potential wage growth and consumer spending
---
Risk Management Framework
Position Sizing Guidelines
Scalping Positions: 0.5-1% account risk per trade
Intraday Trades: 1-2% account risk maximum
Swing Positions: 2-3% account risk per position
Maximum Exposure: 8% total DAX-related risk at any time
Stop-Loss Protocols
Scalping: 20-30 points maximum loss
Intraday: 50-80 points based on volatility
Swing Trading: Below key support levels (23,400 for current longs)
Technical Stops: Below major moving averages and pattern invalidation levels
Profit-Taking Strategy
Scaling Approach: Take 40% at first target, 35% at second target, hold 25% for extensions
Trailing Stops: Implement after 2:1 favorable movement
Time-Based Exits: Close positions before major ECB announcements
Pattern-Based Exits: Honor harmonic pattern completion zones
---
Weekly Outlook Probability Analysis
Bullish Scenario (Probability: 65%)
Catalysts:
- ECB maintains dovish policy stance
- German economic data shows stabilization signs
- Technical breakout above 24,000 with volume
- US-Europe trade tensions remain contained
Price Targets:
- Initial: 24,200-24,400
- Extended: 24,500-24,800
- Optimistic: 25,000+
Neutral/Consolidation Scenario (Probability: 25%)
Characteristics:
- Range-bound trading between 23,600-24,200
- Mixed economic signals from Germany
- ECB policy uncertainty
- Technical indecision at resistance levels
Trading Range:
- Upper Bound: 24,100-24,200
- Lower Bound: 23,500-23,600
- Strategy: Range trading, fade extremes
Bearish Scenario (Probability: 10%)
Risk Factors:
- Significant deterioration in German economic data
- ECB hawkish surprise or policy error
- Major geopolitical shock
- Technical breakdown below 23,400
Downside Targets:
- Initial: 23,000-23,200
- Extended: 22,600-22,800
- Crisis: 22,000-22,400
---
Advanced Trading Techniques
Correlation Analysis
EUR/USD Impact: Strong positive correlation (0.72)
US500 Relationship: Moderate correlation (0.58) with divergence potential
Bond Yields: German Bund yields inverse relationship
Commodity Exposure: Energy prices correlation through industrial components
Options Market Insights
Put/Call Ratio: Currently neutral, no extreme positioning
Options Skew: Slight put premium indicating downside hedging
Gamma Exposure: Positive gamma above 23,800, negative below
Key Strike Levels: 24,000 calls, 23,500 puts show high open interest
Institutional Flow Analysis
Foreign Investment: Positive European equity flows from US institutions
Pension Fund Activity: Rebalancing flows supporting DAX components
Hedge Fund Positioning: Net long but not extreme levels
ETF Flows: Consistent inflows into German equity ETFs
---
For individuals seeking to enhance their trading abilities based on the analyses provided, I recommend exploring the mentoring program offered by Shunya Trade. (Website: shunya dot trade)
I would appreciate your feedback on this analysis, as it will serve as a valuable resource for future endeavors.
Sincerely,
Shunya.Trade
Website: shunya dot trade
---
*This analysis is for educational purposes only and does not constitute investment advice. Always implement proper risk management and consult with qualified financial professionals before making investment decisions.* Disclaimer: This post is intended solely for educational purposes and does not constitute investment advice, financial advice, or trading recommendations. The views expressed herein are derived from technical analysis and are shared for informational purposes only. The stock market inherently carries risks, including the potential for capital loss. Therefore, readers are strongly advised to exercise prudent judgment before making any investment decisions. We assume no liability for any actions taken based on this content. For personalized guidance, it is recommended to consult a certified financial advisor.
---
I am nothing
Disclaimer
The information and publications are not meant to be, and do not constitute, financial, investment, trading, or other types of advice or recommendations supplied or endorsed by TradingView. Read more in the Terms of Use.
I am nothing
Disclaimer
The information and publications are not meant to be, and do not constitute, financial, investment, trading, or other types of advice or recommendations supplied or endorsed by TradingView. Read more in the Terms of Use.