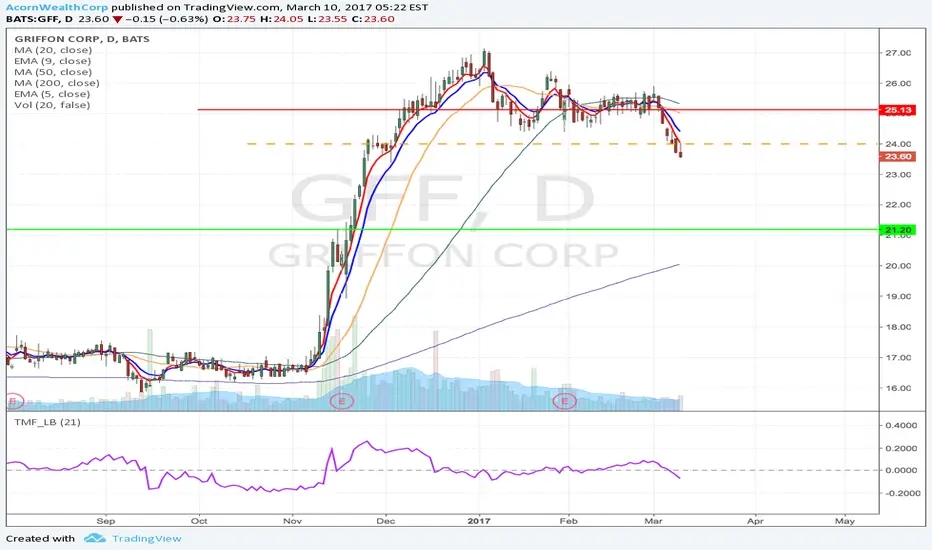
GFF is in the weak Realestate sector, which is rolling over. It seems running within a channel or a descending triangle, and seems heading down. Overall it looks a decent short technically.
* Trade Criteria *
Date first found- March 9, 2017
Pattern/Why- Descending triangle breakdown
Entry Target Criteria- Break of $24
Exit Target Criteria- $21.20
Stop Loss Criteria- $25.13
Please check back for Trade updates. (Note: Trade update is little delayed here.)
* Trade Criteria *
Date first found- March 9, 2017
Pattern/Why- Descending triangle breakdown
Entry Target Criteria- Break of $24
Exit Target Criteria- $21.20
Stop Loss Criteria- $25.13
Please check back for Trade updates. (Note: Trade update is little delayed here.)
Trade active
March 10th - Adjusted upward and hit entry price. Now wait and see.Note
March 14th - Showing some weakness after adjusting to EMA lines, looking good.Note
March 21st- we would consider $25 April Puts 0.80 / July $1.60Note
March 22nd- Possible downward H&SNote
April 3rd - Strong downward move today and closed at the bottom of the range. Looking good as short. $25 April Puts traded as high as $1.60, 100% up from entry, and $25 July Puts traded as high as $2.50Note
April 11th - Downtrend continued as it holds below EMA lines. Looking good as short. $25 April Puts traded as high as $2, 150% up from entry, and $25 July Puts traded as high as $2.45Note
April 12th- updating our stop loss criteria to $24.13Like what you see? Get full access to our 3X daily members only video/txt alerts & live trading room at smartmoneytrading.com/now
Check out some of our free video examples @ smartmoneytrading.com/insights/
Check out some of our free video examples @ smartmoneytrading.com/insights/
Related publications
Disclaimer
The information and publications are not meant to be, and do not constitute, financial, investment, trading, or other types of advice or recommendations supplied or endorsed by TradingView. Read more in the Terms of Use.
Like what you see? Get full access to our 3X daily members only video/txt alerts & live trading room at smartmoneytrading.com/now
Check out some of our free video examples @ smartmoneytrading.com/insights/
Check out some of our free video examples @ smartmoneytrading.com/insights/
Related publications
Disclaimer
The information and publications are not meant to be, and do not constitute, financial, investment, trading, or other types of advice or recommendations supplied or endorsed by TradingView. Read more in the Terms of Use.