Long
GFTUSDT Spot Trade!
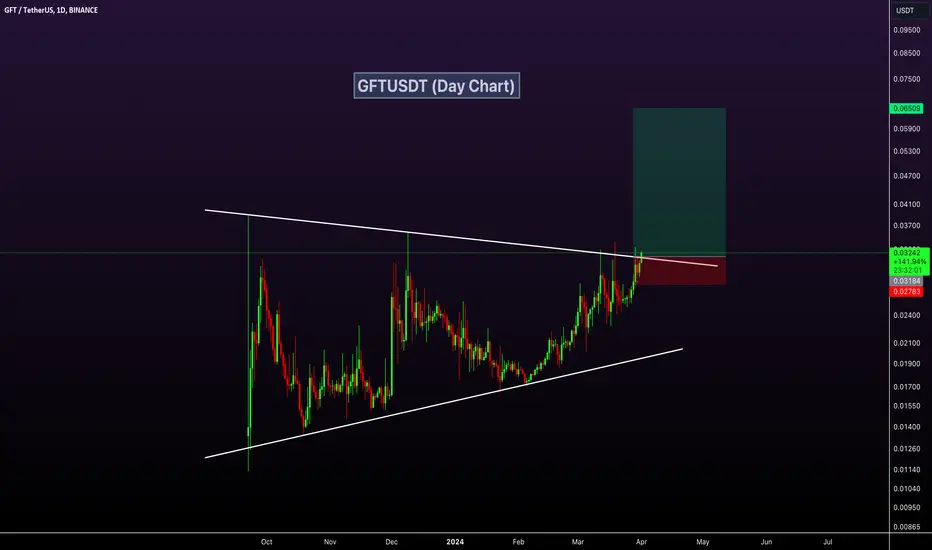
GFTUSDT technical analysis update
GFT price breaking its symmetric triangle pattern in the day chart.
Buy zone : Below $0.033
Stop loss : $0.0275
Regards
Hexa
GFT price breaking its symmetric triangle pattern in the day chart.
Buy zone : Below $0.033
Stop loss : $0.0275
Regards
Hexa
Trade closed: stop reached
🚀Telegram : t.me/hexatrades
🌐Website: hexatrades.io/
🗣️Twitter(X): twitter.com/HexaTrades
🌐Website: hexatrades.io/
🗣️Twitter(X): twitter.com/HexaTrades
Related publications
Disclaimer
The information and publications are not meant to be, and do not constitute, financial, investment, trading, or other types of advice or recommendations supplied or endorsed by TradingView. Read more in the Terms of Use.