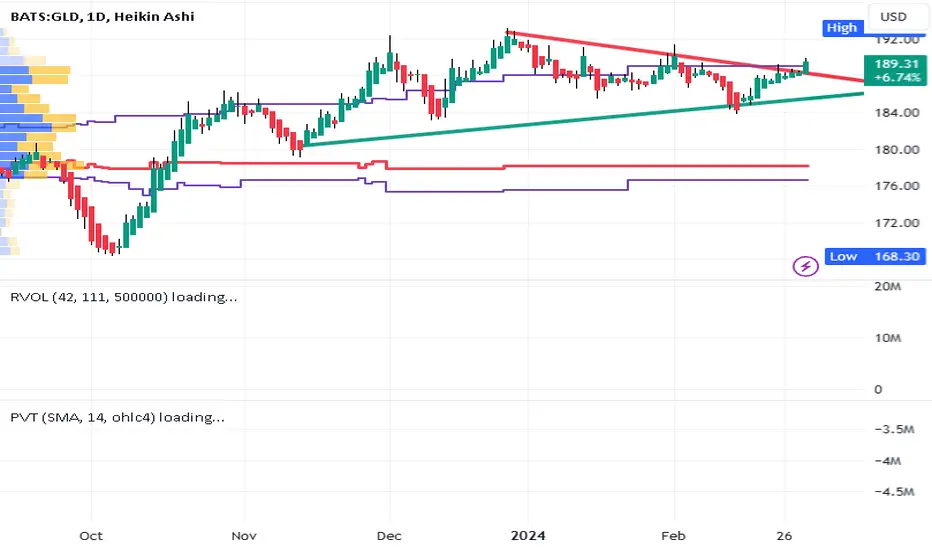
On the daily chart GLD is in a volume profile early breakout going above the jagged pruple line
representing the top of the high volume area. Price has been compressing within a
symmetrical triangle and now has broke through the descending resistance trendline portion of
that. What remains to be seen is a retest of that new support line. Of late Bitcoin has ran up
and probably taken with it market cap away from gold. ( see my idea on the Bitcoin to spot
gold ratio) Now that Bitcoin has topped and is retracing capital is freed up to flow into gold
which has been comparitively weaker. I will take a long trade here and exploit the opportunity
in the cycle between gold and Bitcoin.
Trade active
Decent price movement today. Stop loss still below break even but not by much. Holding full position.Trade active
GLD has bullish momentum now as seen by the volume and volatility indicators
to suggest a push to break the flat top resistance seen on the chart above
Note
Zoom -in here:GLD options striking $188 for mid- November up 25% in 24 hours. Full position. Considering an add if there is a dip but do not expect it. Chart pattern is a high tight flag forecasting more bullish momentum. Geopolitics lending support to gold price.
Trade active
XAUUSD pivoting down on the London Session expect support at $ 2084 Trade active
GLD continues with bullish momentum. Added to call option position with expirationsin December ( as in after the elections).
Note
GLD in an ascending channel is now situated near to the bottom support trend linemaking it in a buy zone to add to a position.
Note
SPOT GOLD compressing in a triangle consolidation on GLD for now awaiting a directional move after that:Disclaimer
The information and publications are not meant to be, and do not constitute, financial, investment, trading, or other types of advice or recommendations supplied or endorsed by TradingView. Read more in the Terms of Use.
Disclaimer
The information and publications are not meant to be, and do not constitute, financial, investment, trading, or other types of advice or recommendations supplied or endorsed by TradingView. Read more in the Terms of Use.