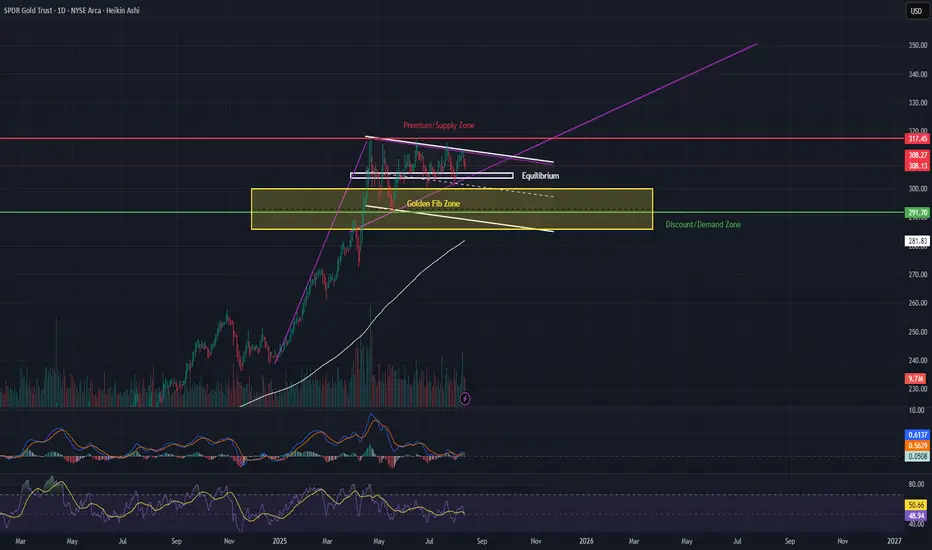
GLD is consolidating within a bullish pennant after its March–April rally, trading near the equilibrium zone (305–307). Price action is tightening, and we’re nearing the apex — meaning a breakout is likely soon.
📈 Bullish Scenario – Bullish Pennant Breakout
Pattern: Bullish pennant, flagpole measured move targets 330–335.
Bullish Entry: On a confirmed daily close above 312–314 with increasing volume.
Take Profits:
1️⃣ TP1: 320 (psychological + resistance)
2️⃣ TP2: 330–335 (measured move target)
Stop Loss: Below 305 (under equilibrium) or conservative SL at 302 (below pennant support).
Why: Holding above equilibrium while contracting in price signals accumulation; breakout could mirror prior leg higher.
📉 Bearish Scenario – Pennant Failure
Bearish Entry: On a daily close below 302–300 with strong sell volume.
Take Profits:
1️⃣ TP1: 292–294 (mid-range)
2️⃣ TP2: 285–290 (discount/demand zone & near 200 EMA)
Stop Loss: Above 307–308 (back inside pennant).
Why: A breakdown here invalidates the bullish pennant and targets deeper retracement toward key support.
💡 Options Trade Ideas
(For traders looking to position with defined risk)
Bullish Breakout Play
Strategy: Buy GLD Calls 4–6 weeks out from breakout confirmation.
Strike: ATM or slightly OTM (e.g., 315C).
Trigger: Break and close above 312–314.
Target Exit: Scale out at 320 and 330–335.
Risk Management: Stop if GLD closes below 305 after breakout.
Bearish Breakdown Play
Strategy: Buy GLD Puts 4–6 weeks out from breakdown confirmation.
Strike: ATM or slightly OTM (e.g., 300P).
Trigger: Break and close below 302–300.
Target Exit: Scale out at 292–294 and 285–290.
Risk Management: Stop if GLD closes above 307 after breakdown.
✨ Golden Fib Zone (Key Confluence Support)
This zone (highlighted in yellow) represents the 61.8% Fibonacci retracement of the March–April rally.
It overlaps with the discount zone and sits just above the discount/demand zone (285–290), making it a high-probability buy area if price pulls back here.
Historically, the Golden Fib acts as a strong reversal area in trending markets, especially when combined with structural support and the 200 EMA.
A bounce from this zone would keep the bullish pennant valid and could serve as a low-risk long entry for swing traders targeting the 320+ zone.
🔍 Key Levels to Watch
Upside: 312.5 → 320 → 330–335
Downside: 305 → 302 → 285–290
⏳ Summary:
GLD is in a pivotal coiling phase. The Golden Fib Zone adds strong confluence for buyers if we see a retracement, while an upside breakout from the pennant could trigger the next leg higher. Either way, this setup is primed for a high-volatility move — be ready for both scenarios.
Disclaimer
The information and publications are not meant to be, and do not constitute, financial, investment, trading, or other types of advice or recommendations supplied or endorsed by TradingView. Read more in the Terms of Use.
Disclaimer
The information and publications are not meant to be, and do not constitute, financial, investment, trading, or other types of advice or recommendations supplied or endorsed by TradingView. Read more in the Terms of Use.