Gold and the Gold ETF - GLD both have weekly RSI readings that are the most over bought since the all - time high.
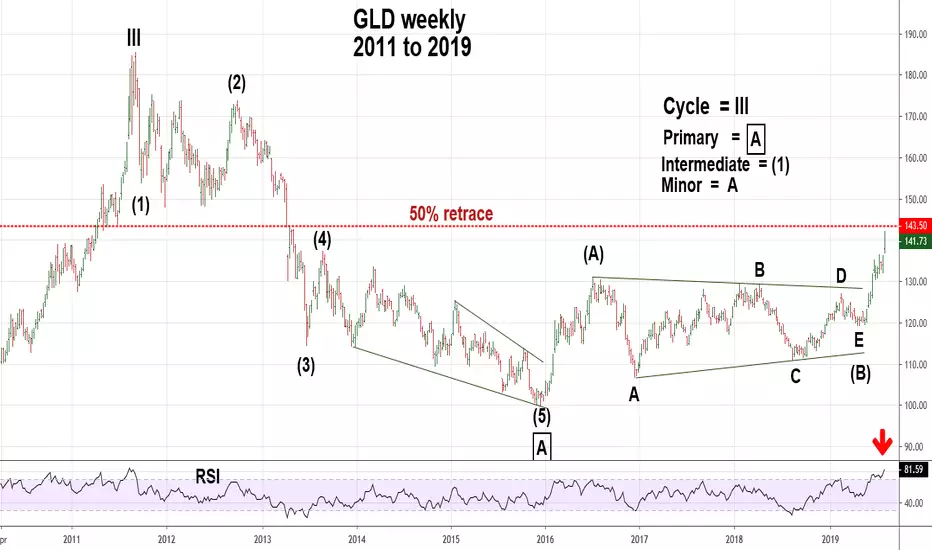
GLD is close to a 50% retrace of the bear market from the all -time high at 143.04
The wave (B) of a probable "A-B-C" rally appears to be an Elliott wave - Horizontal Triangle.
After conclusion of an H Triangle there's usually a post triangle trust - which has happened. The trust is measured by the widest part of the triangle.
Wave "A" = 23.86 + termination point of wave "E" 119.54 + 23.86 = 143.40.
If there's a peak in the resistance zone the subsequent decline could go at least back the bear market bottom of 100.23.
Mark
Disclaimer
The information and publications are not meant to be, and do not constitute, financial, investment, trading, or other types of advice or recommendations supplied or endorsed by TradingView. Read more in the Terms of Use.
Disclaimer
The information and publications are not meant to be, and do not constitute, financial, investment, trading, or other types of advice or recommendations supplied or endorsed by TradingView. Read more in the Terms of Use.