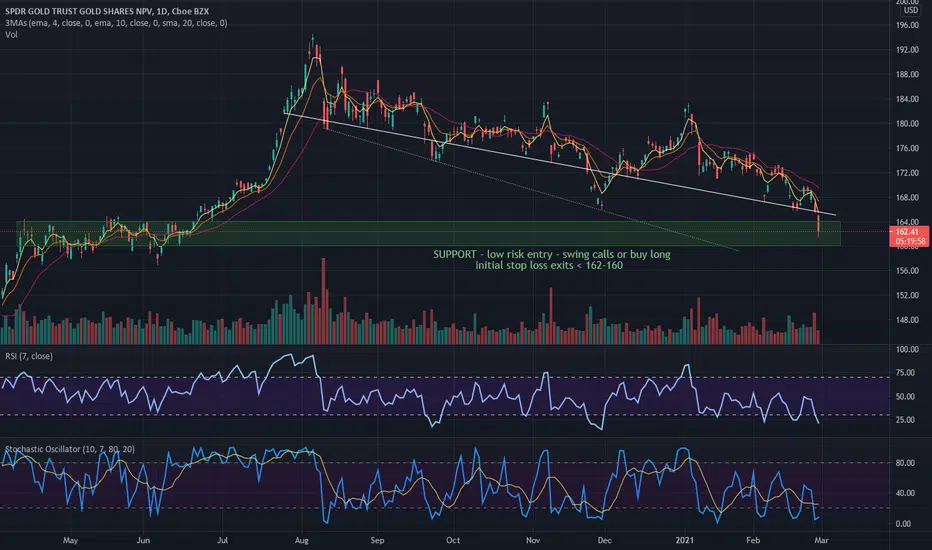
On the weekly and daily charts, my indicators all show that selling may soon be exhausted. On weekly, you can see price is in support zone and you can visually see three waves of selling from top (Sept '20, Nov '20, today). Initially I was looking for 163 to hold but there is too much yield-rising pressure so price is moving down into green support band.
I bought April 170 calls. When it is scary to buy at the bottom, keep your position size small. If GLD moves higher, it will get back over solid white line and you capture a fantastic price move. If this trade idea does not work you lose little (with small position) because you bought very close to stop loss.
I bought April 170 calls. When it is scary to buy at the bottom, keep your position size small. If GLD moves higher, it will get back over solid white line and you capture a fantastic price move. If this trade idea does not work you lose little (with small position) because you bought very close to stop loss.
Trade active
Holding calls. Will need follow through, like a higher high on 30m timeframe, to indicate this may be a bottom here.Trade active
Still holding calls. With April expiry there is plenty of "wiggle" room for price. More importantly, on the hourly chart, There is a bullish divergence between RSI and price. My position is small enough that I can hold through this drop. I am quite curious to see how the daily candle looks at close.Disclaimer
The information and publications are not meant to be, and do not constitute, financial, investment, trading, or other types of advice or recommendations supplied or endorsed by TradingView. Read more in the Terms of Use.
Disclaimer
The information and publications are not meant to be, and do not constitute, financial, investment, trading, or other types of advice or recommendations supplied or endorsed by TradingView. Read more in the Terms of Use.