🪙 GLD Weekly Trade Setup — June 16, 2025
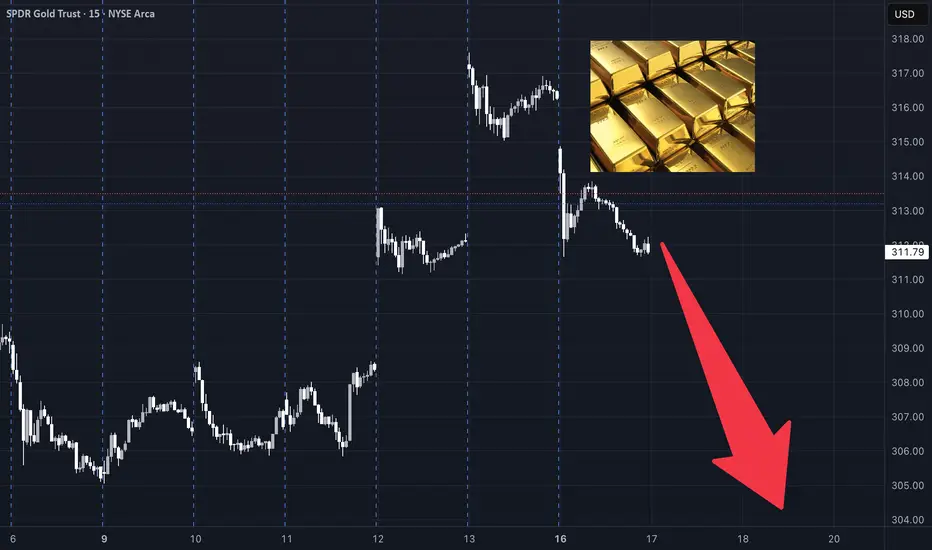
🎯 Instrument: GLD (SPDR Gold Shares)
📉 Strategy: Short Bias via Puts
📅 Entry Timing: Market Open
📈 Confidence Level: 65%
🧠 Technical & Sentiment Snapshot
Current Price: $311.78
5-Min Chart: Below EMAs (10/50/200); RSI ≈ 34 → short-term oversold
Daily Chart: Above 10EMA ($309.94), RSI ≈ 56 → neutral-to-bullish
Bollinger Bands: Near lower band on M5 → volatility likely
Support/Resistance:
• Support: $311.68 / $307.28
• Resistance: $312.20 / $313.00
🗞️ Market Sentiment Overview
VIX: Elevated at 20.82 → high risk premium environment
Options Flow: Heavily put-weighted near $305–$310 strikes
Max Pain: $285 → bearish options bias into expiration
News: Geopolitical tensions increase flight-to-safety temporarily, but fading momentum fuels retrace setups
🔽 Recommended Trade: GLD PUT
Parameter Value
🎯 Strike $307.00
💵 Entry Price $0.84
🎯 Profit Target $1.25–$1.70
🛑 Stop Loss $0.50
📅 Expiry June 20, 2025
📏 Size 1 contract
⚖️ Confidence 65%
🧷 Trade Plan
📥 Entry: At market open
📈 PT Zone: $1.25 to $1.70 premium, based on drop to $306–307
🛑 Stop: If premium drops to $0.50 OR GLD breaks above $313
💰 Risk Mgmt: Keep exposure <2% of total account equity
⚠️ Key Considerations
Upside Risk: Sudden bullish shift or risk-off headlines can drive reversal
Time Decay: Premium erosion risk is higher if GLD consolidates
Volatility Drag: VIX dropping could suppress put premiums quickly
🧾 TRADE_DETAILS (JSON)
json
Copy
Edit
{
"instrument": "GLD",
"direction": "put",
"strike": 307.0,
"expiry": "2025-06-20",
"confidence": 0.65,
"profit_target": 1.25,
"stop_loss": 0.50,
"size": 1,
"entry_price": 0.84,
"entry_timing": "open",
"signal_publish_time": "2025-06-16 16:15:17 UTC-04:00"
}
💡 If GLD struggles to reclaim $312.20 at the open, the put setup becomes attractive. Breakout above $313? Exit quickly.
Free Signals Based on Latest AI models💰: QuantSignals.xyz
Related publications
Disclaimer
The information and publications are not meant to be, and do not constitute, financial, investment, trading, or other types of advice or recommendations supplied or endorsed by TradingView. Read more in the Terms of Use.