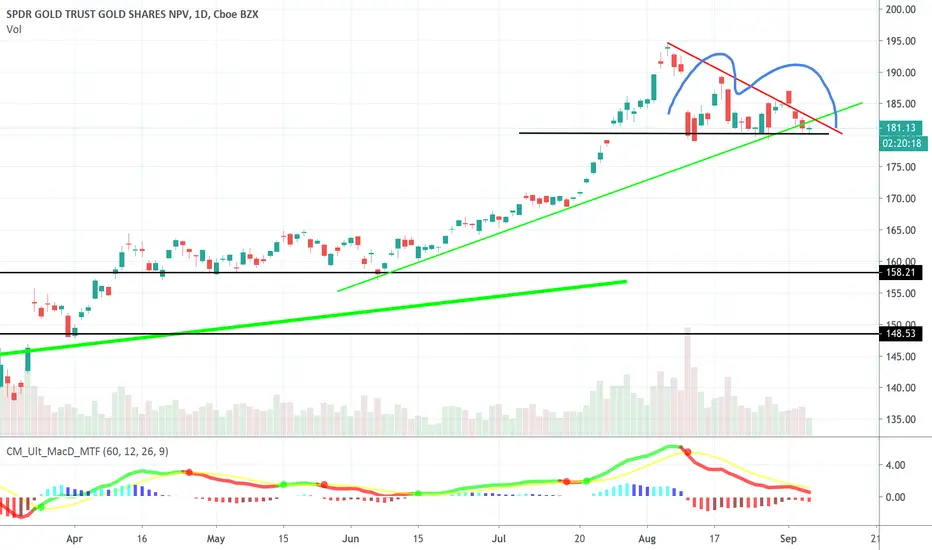
Target: 170. What I see:
* short term descending triangle
* weak MACD almost going negative
* bearish flag on weekly charts
* DXY seems to have found support; may see a bounce with the recent market selloff into cash.
* needs to hold the ~~ 180 level which also happens to be near the 50 day moving average
looks like it is going to break through on the downside to me.
Note
noting there has been quite a surge in the dollar and this chart on a daily and weekly basis continues to look poor. we are getting close to the 170 target; depending on how fast we get there it is worth re-evaluating/closing around there.Related publications
Disclaimer
The information and publications are not meant to be, and do not constitute, financial, investment, trading, or other types of advice or recommendations supplied or endorsed by TradingView. Read more in the Terms of Use.
Related publications
Disclaimer
The information and publications are not meant to be, and do not constitute, financial, investment, trading, or other types of advice or recommendations supplied or endorsed by TradingView. Read more in the Terms of Use.