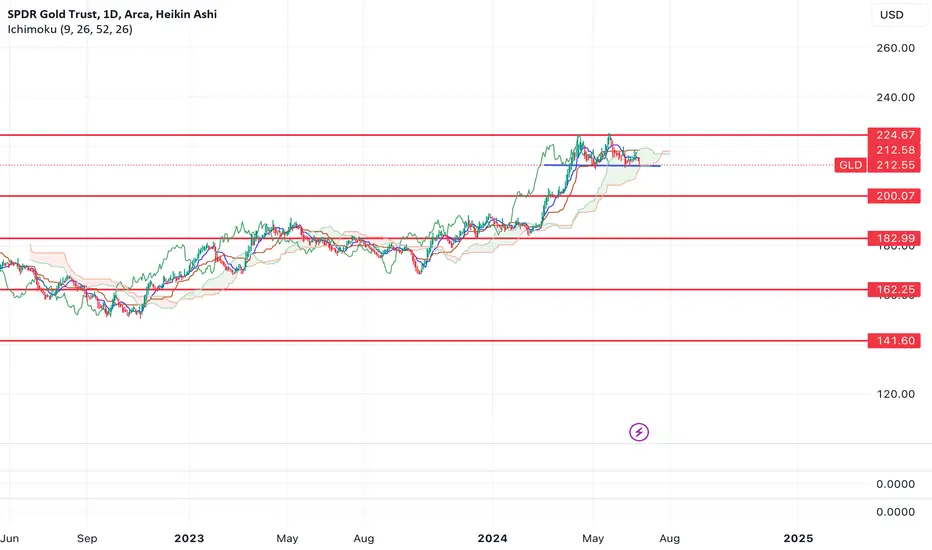
GLD seems to be forming a head and shoulders top here with the right should shallower than the left (a very classic pattern). Should this break down here, I think we're likely setting up for a top in GLD.
The technical target for the breakdown would be the $200 level, but after looking at the chart on larger timeframes, I think this could be a more mid-term top (over the next 6-12 months).
I've marked off key levels to the downside should the pattern break down.
The technical target for the breakdown would be the $200 level, but after looking at the chart on larger timeframes, I think this could be a more mid-term top (over the next 6-12 months).
I've marked off key levels to the downside should the pattern break down.
Disclaimer
The information and publications are not meant to be, and do not constitute, financial, investment, trading, or other types of advice or recommendations supplied or endorsed by TradingView. Read more in the Terms of Use.
Disclaimer
The information and publications are not meant to be, and do not constitute, financial, investment, trading, or other types of advice or recommendations supplied or endorsed by TradingView. Read more in the Terms of Use.