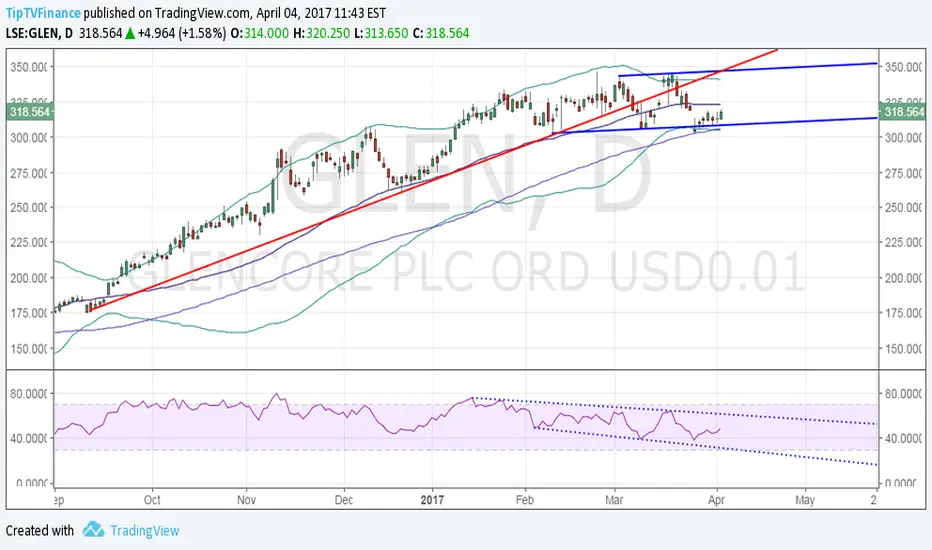
The bearish divergence as is shown by the falling channel on the RSI, coupled with the fact that 50-DMA has topped out suggests the stock is more likely to leave a lower top formation followed by a bearish break from the sideways channel floor seen at 308.30. Such a move would open up downside towards 277 levels (target as per the measured height method).
On the higher side, only a daily close above the 50-DMA would revive bullishness.
On the higher side, only a daily close above the 50-DMA would revive bullishness.
Related publications
Disclaimer
The information and publications are not meant to be, and do not constitute, financial, investment, trading, or other types of advice or recommendations supplied or endorsed by TradingView. Read more in the Terms of Use.
Related publications
Disclaimer
The information and publications are not meant to be, and do not constitute, financial, investment, trading, or other types of advice or recommendations supplied or endorsed by TradingView. Read more in the Terms of Use.