📊 Technical Analysis – Globant (GLOB) – Weekly
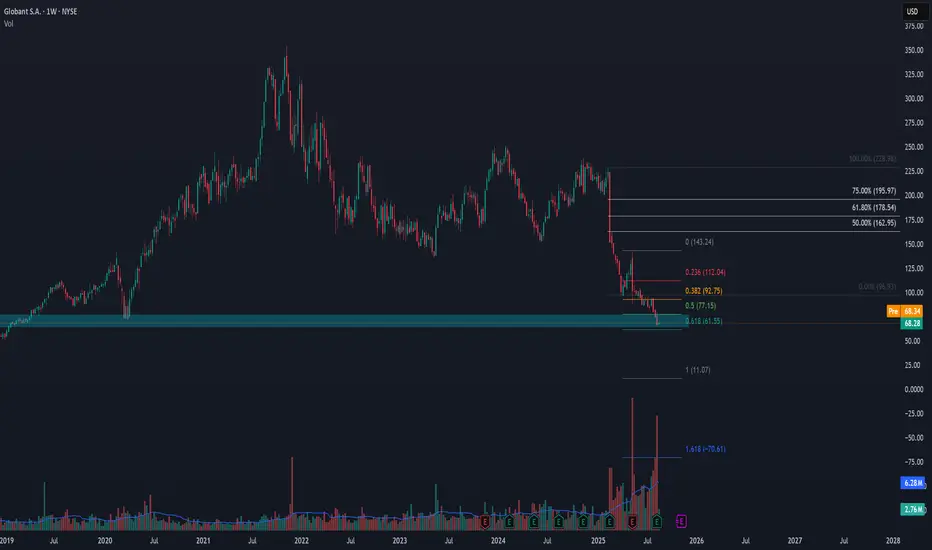
The price of Globant (NYSE: GLOB) remains under strong bearish pressure, approaching a key long-term support area.
🔑 Fibonacci Levels
0.618 (61.55 USD): critical zone currently being tested. A clear breakdown could open the door to further declines.
0.5 (77.15 USD): first major resistance in case of a rebound.
0.382 (92.75 USD): secondary resistance, aligned with previous supply zones.
0.236 (112.04 USD): stronger resistance level; a breakout above would suggest a trend reversal.
📉 Support and Resistance
Main Support: 65–61 USD, which acted as a strong base during 2019–2020.
Immediate Resistance: 77 USD, followed by 93 USD.
🔄 Volume
Volume has increased significantly over the past weeks, indicating strong institutional activity around this support area. This could hint at a potential technical rebound if the level holds.
📌 Conclusion
As long as GLOB holds above 61 USD, there is room for a rebound toward 77–93 USD.
A breakdown below 61 USD would open a more bearish scenario with medium-term targets around 50–45 USD.
Current bias remains bearish, but we are at a key decision zone.
Disclaimer
The information and publications are not meant to be, and do not constitute, financial, investment, trading, or other types of advice or recommendations supplied or endorsed by TradingView. Read more in the Terms of Use.
Disclaimer
The information and publications are not meant to be, and do not constitute, financial, investment, trading, or other types of advice or recommendations supplied or endorsed by TradingView. Read more in the Terms of Use.