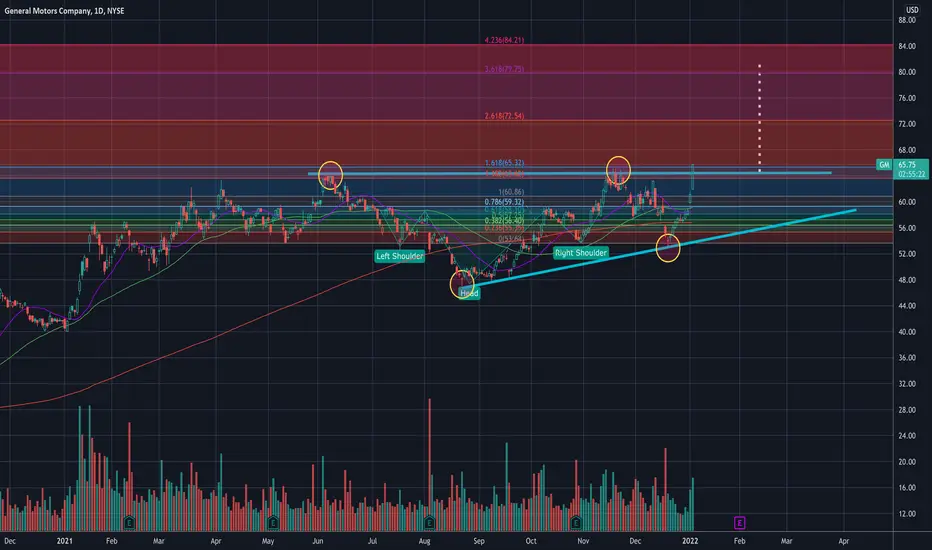
Previous cup and handle failed when the handle broke down and resulting in ascending triangle play now. Looks like GM is about to break out of the ascending triangle it's been forming.
Breaking above $65 for at least 3 trading session is bullish and the price can head to $80 in the long run.
Target 1 - $72.50
Target 2 - $80
Risk - failing to break and stay above $65 and retrace back to $60 - $55 area.
———————————————————
How to read my charts?
- Matching color trend lines shows the pattern. Sometimes a chart can have multiple patterns. Each pattern will have matching color trend lines.
- The yellow horizontal lines shows support and resistance areas.
- Fib lines also shows support and resistance areas.
- The dotted white lines shows price projection for breakout or breakdown target.
Disclaimer: Do your own DD. Not an investment advice.
I am not a licensed professional. None of the posts that I published are investment advice. Do your own research.
Related publications
Disclaimer
The information and publications are not meant to be, and do not constitute, financial, investment, trading, or other types of advice or recommendations supplied or endorsed by TradingView. Read more in the Terms of Use.