As I said in the end of day update yesterday the WEEK OF 06/09 was a doozy.
As part of my #GME20WeekCycle theory that week is significant as it is one of the few dates The Cat specifically "gave us" in his tweets...and serves as significant "line in the sand" from which we should look for significant price improvement (covered in the last 3 video updates) (at least thats my theory)
I expected positive price improvement of course this week...but we got the opposite because of the Convertible offering
Along with that we also got TONS OF VOLATILITY AND VOLUME..which I also expected
So what does the mean as far as the cycle theory goes?
This doesnt change anything for me because I never thought or said that we HAVE to get price improvement during that week..its just what I expected because I anticipated BUY VOLUME to come in
I also was CLEAR in the videos that its not just about the day or week of...its about the WHOLE CYCLE
I specifically talked in last video and in the LIVE on 06/09 about adjusting my expectations and to stop "looking for it all" to happen at one time or any given time..
So again I got 2 out the 3 things I was looking for this week: I got Volume and Volatility..just no Positive Price improvement...YET :)
Looking forward I expect the same thing to transpire as the last Convertible offering: Significant Positive Price Improvement
Last time we saw a 72% run from April low to May high
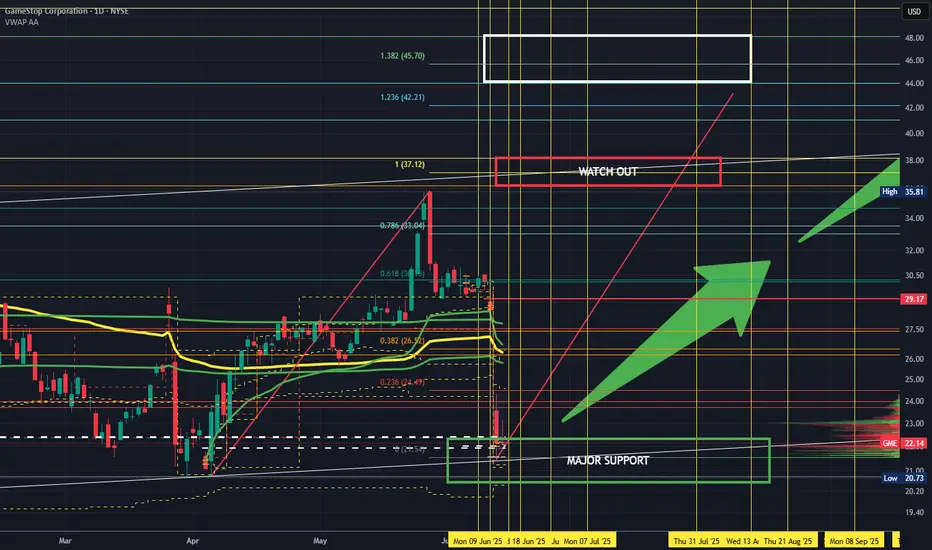
This time I expect 100% move before we see a significant retracement BUT we do need to watch the 38 LEVEL carefully as its a PRIME AREA for retracement due to the presence of overlapping 1.00 extensions....yeah definitely need to watch that area
And yes we are still in a MASSIVE diagonal pattern so look for the ABCs and continue to expect DEEP RETRACEMENTS of ANY significant moves up
GME DECODED

Expanded View of Cycles

Fib Focused Chart. Yellow Vertical lines are FUTURE POTENTIAL PRICE PIVOTS (I absolutely believe these to be powerful)

Above EACH horizontal white line is a Zone of Low Liquidity. There is nothing above 32 but there is also NOW NOTHING ABOVE 22. Once price gets going higher this becomes a VERY REAL PROBLEM FOR SHORTS i.e. why we are getting EPIC SHORTING between 32-34

Next Week. Short Term levels im watching

GOOD TRADING TO YOU ALL!!!
As part of my #GME20WeekCycle theory that week is significant as it is one of the few dates The Cat specifically "gave us" in his tweets...and serves as significant "line in the sand" from which we should look for significant price improvement (covered in the last 3 video updates) (at least thats my theory)
I expected positive price improvement of course this week...but we got the opposite because of the Convertible offering
Along with that we also got TONS OF VOLATILITY AND VOLUME..which I also expected
So what does the mean as far as the cycle theory goes?
This doesnt change anything for me because I never thought or said that we HAVE to get price improvement during that week..its just what I expected because I anticipated BUY VOLUME to come in
I also was CLEAR in the videos that its not just about the day or week of...its about the WHOLE CYCLE
I specifically talked in last video and in the LIVE on 06/09 about adjusting my expectations and to stop "looking for it all" to happen at one time or any given time..
So again I got 2 out the 3 things I was looking for this week: I got Volume and Volatility..just no Positive Price improvement...YET :)
Looking forward I expect the same thing to transpire as the last Convertible offering: Significant Positive Price Improvement
Last time we saw a 72% run from April low to May high
This time I expect 100% move before we see a significant retracement BUT we do need to watch the 38 LEVEL carefully as its a PRIME AREA for retracement due to the presence of overlapping 1.00 extensions....yeah definitely need to watch that area
And yes we are still in a MASSIVE diagonal pattern so look for the ABCs and continue to expect DEEP RETRACEMENTS of ANY significant moves up
GME DECODED
Expanded View of Cycles
Fib Focused Chart. Yellow Vertical lines are FUTURE POTENTIAL PRICE PIVOTS (I absolutely believe these to be powerful)
Above EACH horizontal white line is a Zone of Low Liquidity. There is nothing above 32 but there is also NOW NOTHING ABOVE 22. Once price gets going higher this becomes a VERY REAL PROBLEM FOR SHORTS i.e. why we are getting EPIC SHORTING between 32-34
Next Week. Short Term levels im watching
GOOD TRADING TO YOU ALL!!!
Trade active
Custom indicators doing a fantastic job of defining the cycle periodsWatching for the CMVI indicator in particular to turn green (it measures momentum using rate of change of volume and OBV amongst other things)
Trade closed: target reached
Ok its time to talk about this diagonal structure that I have been trackingThe sheer DEPTH of this pullback from the May high opens the door to the very real possibility that the move up from the April low could possibly be ALL of Wave (iii). If you remember I originally had that wave completing in the 45 region.
This would mean that this next move up could mark the completion of Wave (v).
Here is how we will tell if Wave 3 still needs to head to 45 for completion OR if its already done and this next move up is IN FACT WAVE (v):
If this next move up tops out BEFORE WE REACH 37.12 and sees a DEEP RETRACEMENT (like 30% or more) then this diagonal is likely done and the next move that follows should be EXTREMELY IMPULSIVE with smaller retracements
Why is 37.12 Important?
Remember no matter what structure we are tracking in Elliott Wave the third wave can NEVER be the shortest and in this version of the Diagonal wave count Wave (i) is LONGER than Wave (iii) which means Wave (v) CANNOT be longer than Wave (iii) and the count still be valid
That means if we break 37.12 by even a penny then we are most likely looking at Wave (iii) completing north of 40 around 45 and would still be looking for a deep retracement to back beneath 34 and would still need to complete Wave (5) higher around 55-57 which have us see another deep retracement before the sky clears for us to move higher
Lets see which version plays out
Note
Morning!Casino will be open later
Lets Go!
Note
And thats a wrap!Green day!
More of those are on the way
TICK TOCK
Note
Morning!Casino will be open later
Market showing weakness today and GME may be affected
Lets see what we get
Note
TON of shares borrowed this morningWatch Out
Note
Note
Note
And thats a wrap!Lets see what the FED decision does for the market tomorrow
Related publications
Disclaimer
The information and publications are not meant to be, and do not constitute, financial, investment, trading, or other types of advice or recommendations supplied or endorsed by TradingView. Read more in the Terms of Use.
Related publications
Disclaimer
The information and publications are not meant to be, and do not constitute, financial, investment, trading, or other types of advice or recommendations supplied or endorsed by TradingView. Read more in the Terms of Use.