Yes I still believe the 20 week cycle theory is still valid...lets get that out the way
Volatile stocks like GME are driven by two things mainly: SENTIMENT and the OPTIONS CHAIN
So what I plan to focus on from here on out is MOMENTUM
What I have been focused on behind the scenes is a better way to determine WHEN momentum is picking up so that I can strategically layer in and out with the goal of growing my position over time
I've developed a system that I will be using on GME and all stocks from this point on
Every chart for me starts with understanding the general macro Elliott Wave structure which includes drawing a main macro fib
That main macro fib gives me main longer term targets for the trade..remember each fib is a target for me but im primarily focused on the 0.618, 1.00 and 1.618 fib extensions..so focusing on the chart since the move from last year the next MAJOR FIB TARGET for me is the 0.618 at appox the 56 level

Institutional Trading houses are forward looking and develop a trading thesis for the year that they execute and manage...this process resets every year
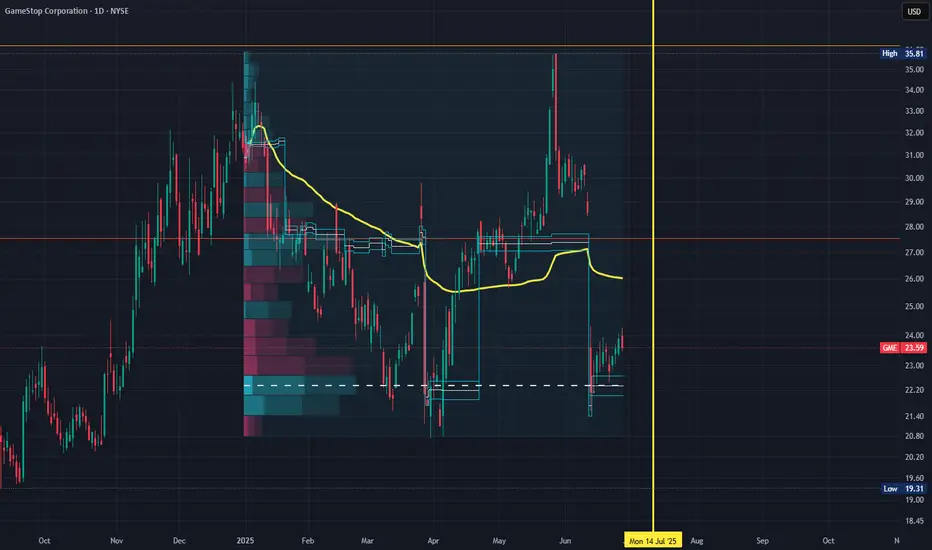
So with that in mind I want to understand 2 things each trading year: Whats the VWAP for the year? and what level is everyone at in relation to where they were (aka whats the Volume Point of Control (VPOC))?
Why? Because those tell us where EVERYONE is in relation to VWAP...the direction price moves away from VWAP tells us what the major players intentions are..and i want to FOLLOW THE MONEY

But in order for price to move away from VWAP..MOMENTUM has to BUILD and SUSTAIN
There are many ways to measure momentum on a chart but the way that works best for me is to focus on the RATE OF CHANGE (ROC) of PRICE & VOLUME
As mentioned last week Ive developed and tuned a custom indicator to help me intimately understand ROC
Im focusing on four time frames: Yearly, 3 Month, 3 Week and 3 Day
Alignment= same timeframe color and position in relation to zero line
Alignment = Strength= look to BUY
Not in alignment= Weakness= look to SELL
NOTE: This view is what you will primarily see posted going forward as this is what im using on ALL stocks to trade in and out

Cant wait to see how this chart looks by year end :)

GOOD TRADING TO YOU ALL!!!
Volatile stocks like GME are driven by two things mainly: SENTIMENT and the OPTIONS CHAIN
So what I plan to focus on from here on out is MOMENTUM
What I have been focused on behind the scenes is a better way to determine WHEN momentum is picking up so that I can strategically layer in and out with the goal of growing my position over time
I've developed a system that I will be using on GME and all stocks from this point on
Every chart for me starts with understanding the general macro Elliott Wave structure which includes drawing a main macro fib
That main macro fib gives me main longer term targets for the trade..remember each fib is a target for me but im primarily focused on the 0.618, 1.00 and 1.618 fib extensions..so focusing on the chart since the move from last year the next MAJOR FIB TARGET for me is the 0.618 at appox the 56 level
Institutional Trading houses are forward looking and develop a trading thesis for the year that they execute and manage...this process resets every year
So with that in mind I want to understand 2 things each trading year: Whats the VWAP for the year? and what level is everyone at in relation to where they were (aka whats the Volume Point of Control (VPOC))?
Why? Because those tell us where EVERYONE is in relation to VWAP...the direction price moves away from VWAP tells us what the major players intentions are..and i want to FOLLOW THE MONEY
But in order for price to move away from VWAP..MOMENTUM has to BUILD and SUSTAIN
There are many ways to measure momentum on a chart but the way that works best for me is to focus on the RATE OF CHANGE (ROC) of PRICE & VOLUME
As mentioned last week Ive developed and tuned a custom indicator to help me intimately understand ROC
Im focusing on four time frames: Yearly, 3 Month, 3 Week and 3 Day
Alignment= same timeframe color and position in relation to zero line
Alignment = Strength= look to BUY
Not in alignment= Weakness= look to SELL
NOTE: This view is what you will primarily see posted going forward as this is what im using on ALL stocks to trade in and out
Cant wait to see how this chart looks by year end :)
GOOD TRADING TO YOU ALL!!!
Related publications
Disclaimer
The information and publications are not meant to be, and do not constitute, financial, investment, trading, or other types of advice or recommendations supplied or endorsed by TradingView. Read more in the Terms of Use.
Related publications
Disclaimer
The information and publications are not meant to be, and do not constitute, financial, investment, trading, or other types of advice or recommendations supplied or endorsed by TradingView. Read more in the Terms of Use.