Let me start by saying that I still do not think the 20 Week Cycle Theory has been invalidated
We are only a couple weeks in on what is again a 20 WEEK CYCLE
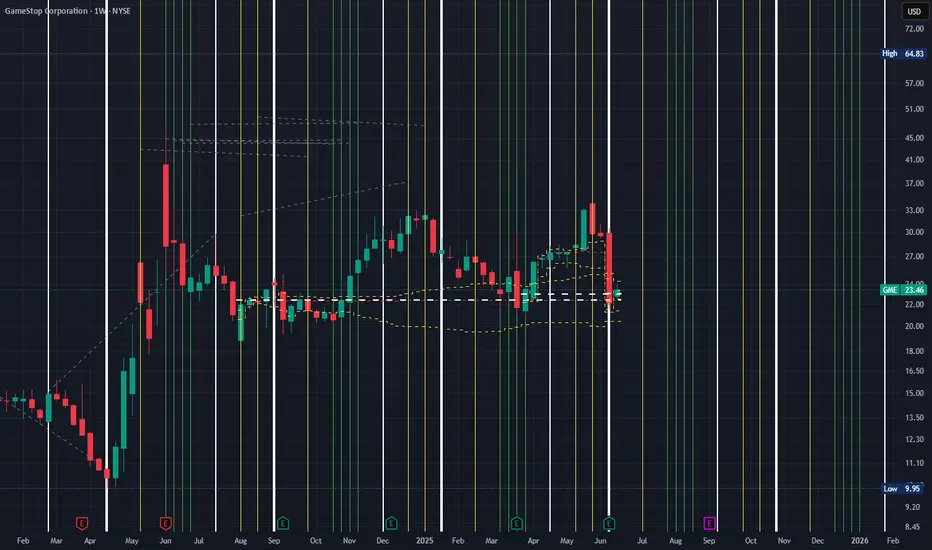
With that in mind based on the cycle view displayed, at this point, I have to assume this cycle will be similar to the last cycles in that the price appreciation should take place aligned with the GREEN vertical lines...which corresponds with the end of July/ beginning of Aug timeframe
The question is what does the price action look like in the meantime?
A lot of that depends on what the broader market looks like and what levels hold on GME
I do not have a crystal ball
For what its worth I have additional buys set to trigger at 21.50 and 22 with a tight stop loss in case of any moves lower
Ok now lets talk momentum
GME is obviously vary volatile and extremely beholden to the options market
I have been working for months behind the scenes on fine tuning my custom indicators to provide a stable view of increases/ decreases in momentum..and have now reached that point
On the below indicator view , generally speaking, if all 3 Histograms are GREEN and ABOVE the ZERO LINE then price is showing HIGH BULLISH MOMENTUM...and vice versa for Selling Momentum
So with that said as you see GME is still showing a lot of weakness and until we see the bullishness conditions mentioned above I expect price action to be somewhat muted
GOOD TRADING TO YOU ALL
We are only a couple weeks in on what is again a 20 WEEK CYCLE
With that in mind based on the cycle view displayed, at this point, I have to assume this cycle will be similar to the last cycles in that the price appreciation should take place aligned with the GREEN vertical lines...which corresponds with the end of July/ beginning of Aug timeframe
The question is what does the price action look like in the meantime?
A lot of that depends on what the broader market looks like and what levels hold on GME
I do not have a crystal ball
For what its worth I have additional buys set to trigger at 21.50 and 22 with a tight stop loss in case of any moves lower
Ok now lets talk momentum
GME is obviously vary volatile and extremely beholden to the options market
I have been working for months behind the scenes on fine tuning my custom indicators to provide a stable view of increases/ decreases in momentum..and have now reached that point
On the below indicator view , generally speaking, if all 3 Histograms are GREEN and ABOVE the ZERO LINE then price is showing HIGH BULLISH MOMENTUM...and vice versa for Selling Momentum
So with that said as you see GME is still showing a lot of weakness and until we see the bullishness conditions mentioned above I expect price action to be somewhat muted
GOOD TRADING TO YOU ALL
Trade active
Trade closed: target reached
Related publications
Disclaimer
The information and publications are not meant to be, and do not constitute, financial, investment, trading, or other types of advice or recommendations supplied or endorsed by TradingView. Read more in the Terms of Use.
Related publications
Disclaimer
The information and publications are not meant to be, and do not constitute, financial, investment, trading, or other types of advice or recommendations supplied or endorsed by TradingView. Read more in the Terms of Use.