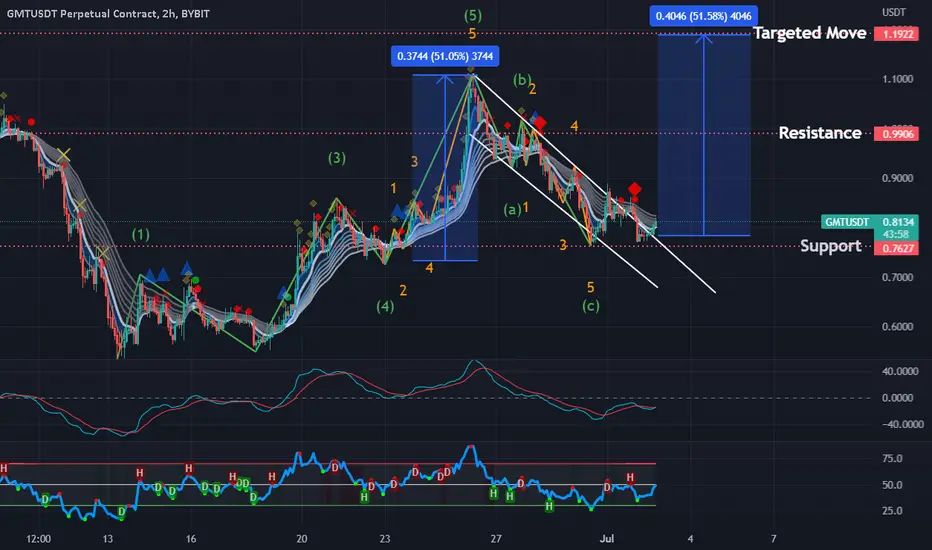
GMT has double bottomed at the bottom of this falling channel with price breaking out as well. Coincidentally, this happens to be major support for GMT as well. Wave C is complete and I have my target based off of the pole. We will be set for my target once we break the resistance I have labeled.
This chart based off of The Elliot Wave Theory, Fibonacci, EMA’s, RSI, resistance/support zones, and patterns to create the most probable outcome.
This chart based off of The Elliot Wave Theory, Fibonacci, EMA’s, RSI, resistance/support zones, and patterns to create the most probable outcome.
Disclaimer
The information and publications are not meant to be, and do not constitute, financial, investment, trading, or other types of advice or recommendations supplied or endorsed by TradingView. Read more in the Terms of Use.
Disclaimer
The information and publications are not meant to be, and do not constitute, financial, investment, trading, or other types of advice or recommendations supplied or endorsed by TradingView. Read more in the Terms of Use.