The following content is machine translation:
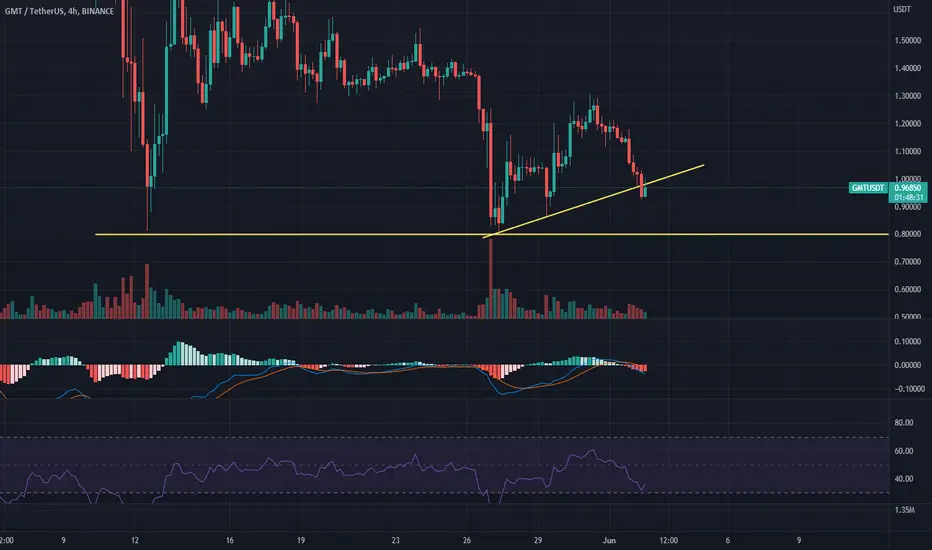
GMT, below the uptrend line.
On the 4-hour chart, it hit a low of 0.8 on May 12, stopped falling and rebounded, and then stepped back and rebounded around 0.8. The high point of this rebound is lower, and it currently falls below the rising trend line of this rebound, and it may drop again. To the vicinity of 0.8, bearish.
The zero axis below the speed line of the macd indicator will run below. The RSI indicator is near the oversold zone, bearish.
In operation, it has fallen below the rising trend line, but the continuous decline and the RSI indicator are rising near the oversold zone, and it may rebound a bit. Here, you can wait for the rebound to weaken and go short and look down at around 0.8.
📈📉 Join our analysis channel,加入我们的频道:👇
t.me/CryptoObservation
📈📉 我们的中文电报社区:👇
t.me/CryptoMiningCN
☯️ 我们目前提供更高准确度的交易指引,请加入我们的电报社区后和管理员联系。☯️
t.me/CryptoObservation
📈📉 我们的中文电报社区:👇
t.me/CryptoMiningCN
☯️ 我们目前提供更高准确度的交易指引,请加入我们的电报社区后和管理员联系。☯️
Disclaimer
The information and publications are not meant to be, and do not constitute, financial, investment, trading, or other types of advice or recommendations supplied or endorsed by TradingView. Read more in the Terms of Use.