Check out our latest GMTUSDT analysis which is on %80 profit right now.

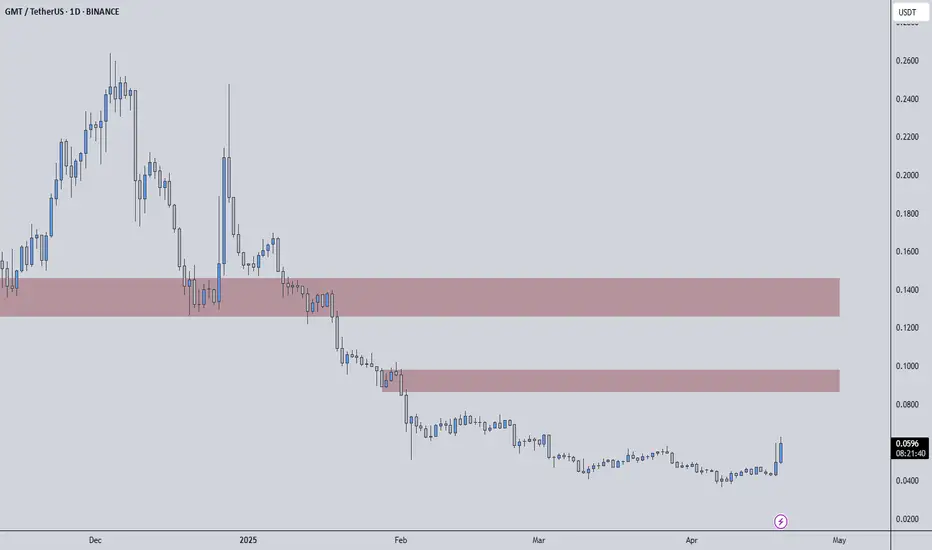
GMTUSDT is currently facing some challenges, and it’s not looking particularly favorable in the short term. The red boxes are acting as significant resistance zones, where the price has struggled to break through in the past. As we know, these levels are likely to continue attracting selling pressure, so we need to be cautious here.
From a strategic standpoint, I’m still maintaining a bearish outlook until proven otherwise. The price hasn’t shown any significant bullish momentum yet, and these red zones could prove to be difficult for buyers to break through. If you’re considering shorting, look for confirmations on lower timeframes around these red boxes. A clear rejection or failed break above these levels could present a strong shorting opportunity.
That said, if the price does manage to break above the red zones with volume and confirms these levels as support, I’ll be open to considering long positions. However, I won’t rush into any trades without seeing a confirmed change in momentum.
Remember, patience and smart trading with confirmation are key to avoiding unnecessary risks. Keep an eye on these red boxes, but don’t jump the gun—let the market show its intention before acting. We’re here to follow a well-defined strategy, not chase every move. If the price pushes above these levels and holds, it could be time to look for a possible long entry, but until then, staying cautious and following the flow is the way to go.
Always use proper risk management, and don’t forget to trade with the plan you’ve set, using the confirmations that matter most.
📌I keep my charts clean and simple because I believe clarity leads to better decisions.
📌My approach is built on years of experience and a solid track record. I don’t claim to know it all but I’m confident in my ability to spot high-probability setups.
📌If you would like to learn how to use the heatmap, cumulative volume delta and volume footprint techniques that I use below to determine very accurate demand regions, you can send me a private message. I help anyone who wants it completely free of charge.
🔑I have a long list of my proven technique below:
I stopped adding to the list because it's kinda tiring to add 5-10 charts in every move but you can check my profile and see that it goes on..
GMTUSDT is currently facing some challenges, and it’s not looking particularly favorable in the short term. The red boxes are acting as significant resistance zones, where the price has struggled to break through in the past. As we know, these levels are likely to continue attracting selling pressure, so we need to be cautious here.
From a strategic standpoint, I’m still maintaining a bearish outlook until proven otherwise. The price hasn’t shown any significant bullish momentum yet, and these red zones could prove to be difficult for buyers to break through. If you’re considering shorting, look for confirmations on lower timeframes around these red boxes. A clear rejection or failed break above these levels could present a strong shorting opportunity.
That said, if the price does manage to break above the red zones with volume and confirms these levels as support, I’ll be open to considering long positions. However, I won’t rush into any trades without seeing a confirmed change in momentum.
Remember, patience and smart trading with confirmation are key to avoiding unnecessary risks. Keep an eye on these red boxes, but don’t jump the gun—let the market show its intention before acting. We’re here to follow a well-defined strategy, not chase every move. If the price pushes above these levels and holds, it could be time to look for a possible long entry, but until then, staying cautious and following the flow is the way to go.
Always use proper risk management, and don’t forget to trade with the plan you’ve set, using the confirmations that matter most.
📌I keep my charts clean and simple because I believe clarity leads to better decisions.
📌My approach is built on years of experience and a solid track record. I don’t claim to know it all but I’m confident in my ability to spot high-probability setups.
📌If you would like to learn how to use the heatmap, cumulative volume delta and volume footprint techniques that I use below to determine very accurate demand regions, you can send me a private message. I help anyone who wants it completely free of charge.
🔑I have a long list of my proven technique below:
- 🎯 ZENUSDT.P: Patience & Profitability | %230 Reaction from the Sniper Entry
- 🐶 DOGEUSDT.P: Next Move
- 🎨 RENDERUSDT.P: Opportunity of the Month
- 💎 ETHUSDT.P: Where to Retrace
- 🟢 BNBUSDT.P: Potential Surge
- 📊 BTC Dominance: Reaction Zone
- 🌊 WAVESUSDT.P: Demand Zone Potential
- 🟣 UNIUSDT.P: Long-Term Trade
- 🔵 XRPUSDT.P: Entry Zones
- 🔗 LINKUSDT.P: Follow The River
- 📈 BTCUSDT.P: Two Key Demand Zones
- 🟩 POLUSDT: Bullish Momentum
- 🌟 PENDLEUSDT.P: Where Opportunity Meets Precision
- 🔥 BTCUSDT.P: Liquidation of Highly Leveraged Longs
- 🌊 SOLUSDT.P: SOL's Dip - Your Opportunity
- 🐸 1000PEPEUSDT.P: Prime Bounce Zone Unlocked
- 🚀 ETHUSDT.P: Set to Explode - Don't Miss This Game Changer
- 🤖 IQUSDT: Smart Plan
- ⚡️ PONDUSDT: A Trade Not Taken Is Better Than a Losing One
- 💼 STMXUSDT: 2 Buying Areas
- 🐢 TURBOUSDT: Buy Zones and Buyer Presence
- 🌍 ICPUSDT.P: Massive Upside Potential | Check the Trade Update For Seeing Results
- 🟠 IDEXUSDT: Spot Buy Area | %26 Profit if You Trade with MSB
- 📌 USUALUSDT: Buyers Are Active + %70 Profit in Total
- 🌟 FORTHUSDT: Sniper Entry +%26 Reaction
- 🐳 QKCUSDT: Sniper Entry +%57 Reaction
- 📊 BTC.D: Retest of Key Area Highly Likely
- 📊 XNOUSDT %80 Reaction with a Simple Blue Box!
- 📊 BELUSDT Amazing %120 Reaction!
I stopped adding to the list because it's kinda tiring to add 5-10 charts in every move but you can check my profile and see that it goes on..
Professional Day Trader
Microstructure Practicioner
t.me/umuttrades
kick.com/umuttrades live everyday.
Microstructure Practicioner
t.me/umuttrades
kick.com/umuttrades live everyday.
Related publications
Disclaimer
The information and publications are not meant to be, and do not constitute, financial, investment, trading, or other types of advice or recommendations supplied or endorsed by TradingView. Read more in the Terms of Use.