GMXUSDT Technical analysis update
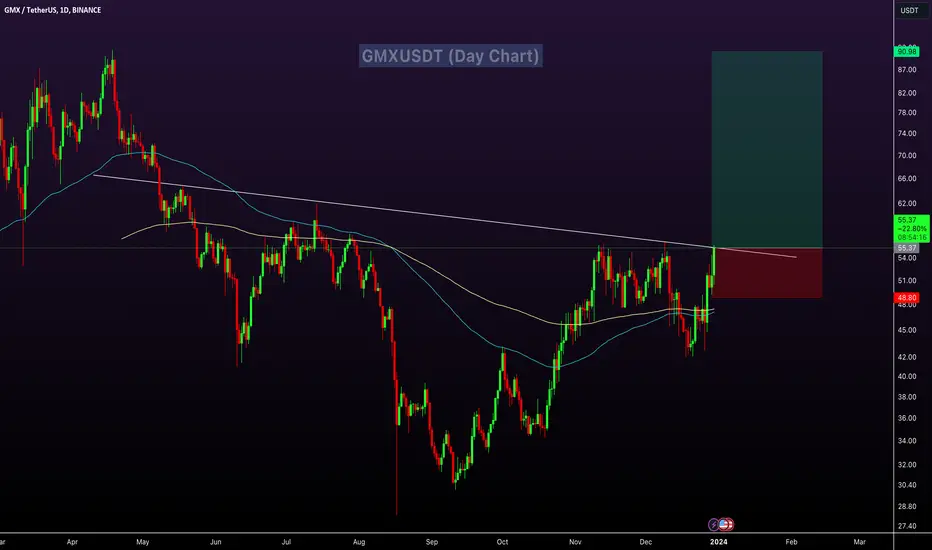
GMXUSDT has formed an inverse head and shoulder pattern on the daily chart. With the price breaking its neckline, this suggests a potential bullish signal for GMX.
Buy zone: Below $55.50
Stop loss : $48.75
Take Profit 1: $60.50
Take Profit 2: $72.00
Take Profit 3: $90.00
Thanks
Hexa
GMXUSDT has formed an inverse head and shoulder pattern on the daily chart. With the price breaking its neckline, this suggests a potential bullish signal for GMX.
Buy zone: Below $55.50
Stop loss : $48.75
Take Profit 1: $60.50
Take Profit 2: $72.00
Take Profit 3: $90.00
Thanks
Hexa
🚀Telegram : t.me/hexatrades
🌐Website: hexatrades.io/
🗣️Twitter(X): twitter.com/HexaTrades
🌐Website: hexatrades.io/
🗣️Twitter(X): twitter.com/HexaTrades
Related publications
Disclaimer
The information and publications are not meant to be, and do not constitute, financial, investment, trading, or other types of advice or recommendations supplied or endorsed by TradingView. Read more in the Terms of Use.