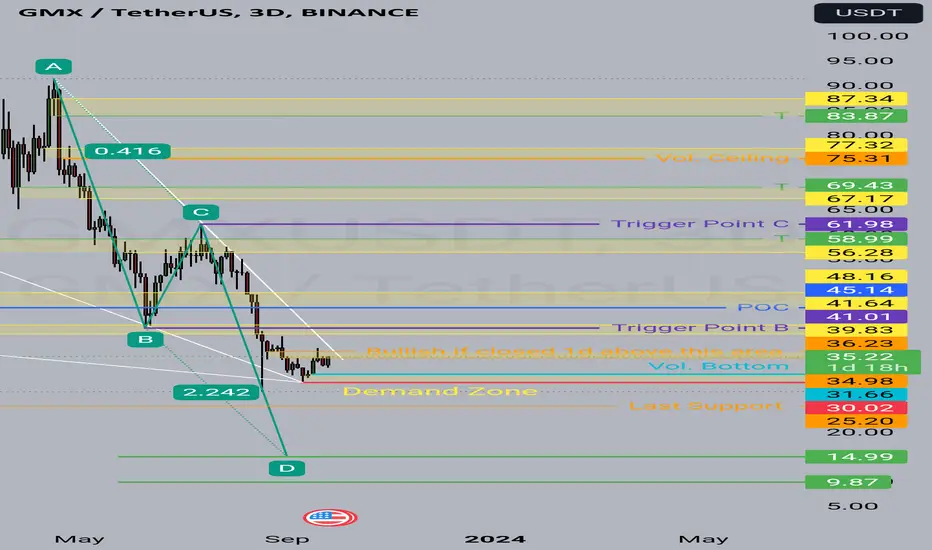
GMX is bullish on the 1d and 3d charts
It will be bullish once it closes 1d above $36.23.
But keep in mind if it closes below the red line, then you have two scenarios
1. It touches the last support then it rebounds
Or
2. It goes to the assigned area for the harmonic pattern
All the best insha Allah!
It will be bullish once it closes 1d above $36.23.
But keep in mind if it closes below the red line, then you have two scenarios
1. It touches the last support then it rebounds
Or
2. It goes to the assigned area for the harmonic pattern
All the best insha Allah!
I draw charts according to Volume 🔰
📌 Disclaimer: I do my best, but the market's unpredictability is a constant reminder of its untamed nature. Trade wisely and manage your risk. 🛡️
📌 Disclaimer: I do my best, but the market's unpredictability is a constant reminder of its untamed nature. Trade wisely and manage your risk. 🛡️
Disclaimer
The information and publications are not meant to be, and do not constitute, financial, investment, trading, or other types of advice or recommendations supplied or endorsed by TradingView. Read more in the Terms of Use.