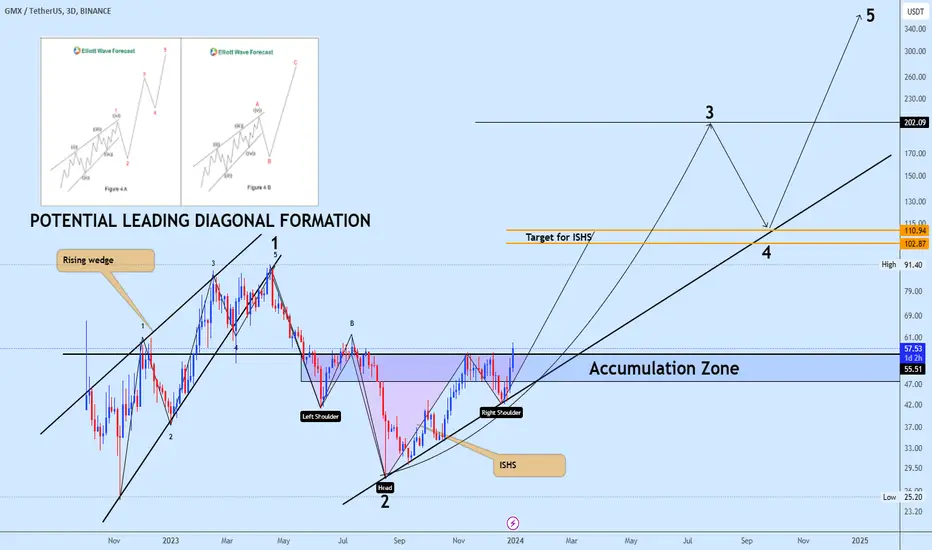
The GMXUSDT trading pair is displaying initial stages of an Elliott Wave formation, characterized by leading diagonal structures, with the completion of the Wave 1 to Wave 2 sequence.
The price is currently forming a robust bullish continuation pattern, identified as an Inverse Head and Shoulders (IH&S), with the pattern's price target indicated on the chart.
Additionally, the projection for the culmination of the current Wave 3 is also delineated. The designated accumulation zone on the chart represents an opportune area for initiating long positions.
As always, it is prudent to engage in trading with due diligence, implementing a suitable stop-loss strategy to manage risk effectively.
We welcome your engagement with our analysis in the form of comments and likes.
Trade active
Price consolidation in progress. Keep holding and waiting for the big pump📢Follow the official links only! Trade smart, stay safe! 🎯
Telegram: t.me/+m0IACMn0ul03OTFk
Forex zone: t.me/+piiPgrNtrulkNDk0
💎 Premium details: t.me/wcsepayment
📩 Promotion/Partnership: t.me/WESLAD
Telegram: t.me/+m0IACMn0ul03OTFk
Forex zone: t.me/+piiPgrNtrulkNDk0
💎 Premium details: t.me/wcsepayment
📩 Promotion/Partnership: t.me/WESLAD
Disclaimer
The information and publications are not meant to be, and do not constitute, financial, investment, trading, or other types of advice or recommendations supplied or endorsed by TradingView. Read more in the Terms of Use.
📢Follow the official links only! Trade smart, stay safe! 🎯
Telegram: t.me/+m0IACMn0ul03OTFk
Forex zone: t.me/+piiPgrNtrulkNDk0
💎 Premium details: t.me/wcsepayment
📩 Promotion/Partnership: t.me/WESLAD
Telegram: t.me/+m0IACMn0ul03OTFk
Forex zone: t.me/+piiPgrNtrulkNDk0
💎 Premium details: t.me/wcsepayment
📩 Promotion/Partnership: t.me/WESLAD
Disclaimer
The information and publications are not meant to be, and do not constitute, financial, investment, trading, or other types of advice or recommendations supplied or endorsed by TradingView. Read more in the Terms of Use.