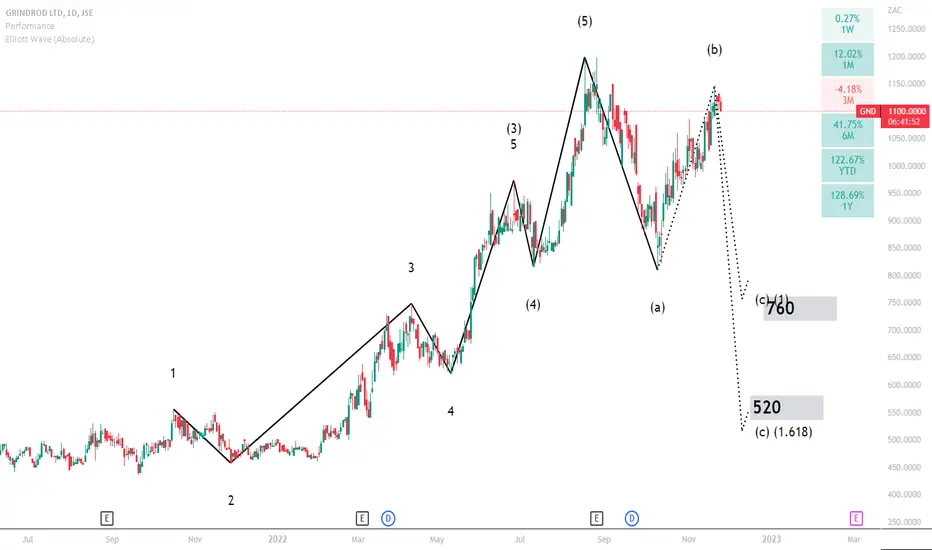
A typical Elliott wave count is unfolding.
A corrective wave back to 760 and 520 seems likely.
A break above wave b which is around 1150 will negate the wave count.
The Elliott Wave theory is a theory in technical analysis used to describe price movements in the financial market. Waves can be identified in share price movements and in consumer behavior. Investors trying to profit from a market trend could be described as riding a wave.
Disclaimer
The information and publications are not meant to be, and do not constitute, financial, investment, trading, or other types of advice or recommendations supplied or endorsed by TradingView. Read more in the Terms of Use.
Disclaimer
The information and publications are not meant to be, and do not constitute, financial, investment, trading, or other types of advice or recommendations supplied or endorsed by TradingView. Read more in the Terms of Use.
