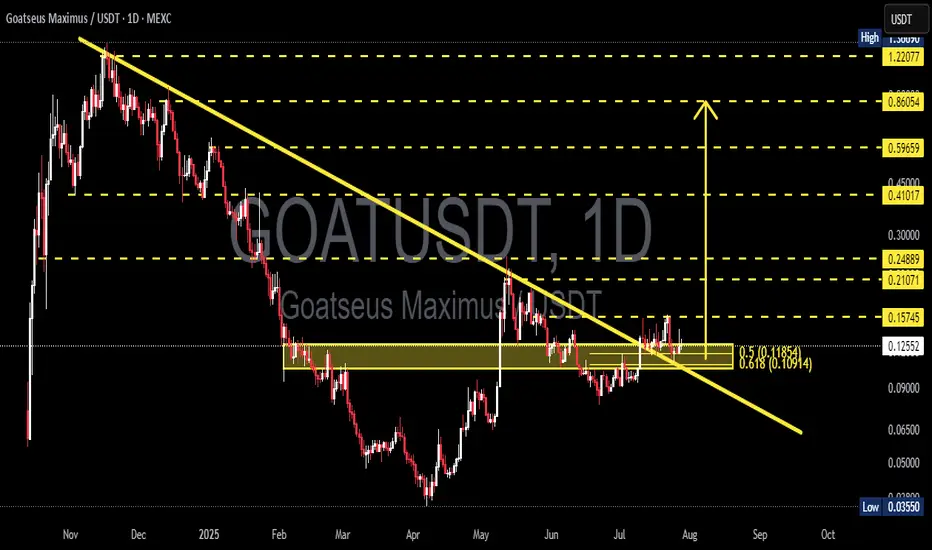
The daily chart of GOATUSDT reveals a significant technical development as price breaks out of a long-term descending trendline and is now performing a crucial retest of a key support zone. This movement is attracting attention from swing traders and mid-term investors alike.
---
🔍 Pattern Analysis & Market Structure
Main Pattern: Breakout from a long-standing descending trendline (yellow line) that has capped price action since November 2024.
Key Consolidation Zone: A visible accumulation area (yellow box) between 0.10914 (Fib 0.618) and 0.11864 (Fib 0.5), now being retested as new support.
Fibonacci Retracement: Applied from the peak to the bottom to identify logical target zones and potential resistance.
Breakout Confirmation: Price cleanly broke above the trendline, pulled back to retest support, and is showing signs of holding — a potential bullish continuation signal.
---
🟢 Bullish Scenario
If price holds above the 0.11–0.12 zone:
The breakout is validated and opens room for a continued rally.
Key upside targets based on Fibonacci levels:
🔼 0.15745 – first resistance
🔼 0.21071 to 0.24889 – mid-range resistance cluster
🔼 0.41017 to 0.86054 – longer-term price targets
Bullish confirmation via price action or volume spikes can solidify this outlook.
---
🔴 Bearish Scenario
If price fails to hold the support zone:
A breakdown below 0.10914 invalidates the breakout, indicating a false breakout trap.
Downside targets may include:
0.09000 – local support
0.06500 and 0.03550 – major historical support zones
This scenario would likely reignite bearish momentum.
---
⚠️ Conclusion
GOATUSDT is currently at a critical technical crossroad. The recent breakout and retest could signify a structural trend reversal. If the current support holds, the potential for upside is significant. However, a failure here could lead to deeper correction or consolidation.
---
📌 Key Levels to Watch:
Support: 0.109 – 0.118
Resistance: 0.15745 / 0.21071 / 0.24889 / 0.41017
#GOATUSDT #CryptoBreakout #TechnicalAnalysis #AltcoinSeason #TrendlineBreakout #SupportResistance #FibonacciLevels #SwingTrade #PriceAction #CryptoTA
---
🔍 Pattern Analysis & Market Structure
Main Pattern: Breakout from a long-standing descending trendline (yellow line) that has capped price action since November 2024.
Key Consolidation Zone: A visible accumulation area (yellow box) between 0.10914 (Fib 0.618) and 0.11864 (Fib 0.5), now being retested as new support.
Fibonacci Retracement: Applied from the peak to the bottom to identify logical target zones and potential resistance.
Breakout Confirmation: Price cleanly broke above the trendline, pulled back to retest support, and is showing signs of holding — a potential bullish continuation signal.
---
🟢 Bullish Scenario
If price holds above the 0.11–0.12 zone:
The breakout is validated and opens room for a continued rally.
Key upside targets based on Fibonacci levels:
🔼 0.15745 – first resistance
🔼 0.21071 to 0.24889 – mid-range resistance cluster
🔼 0.41017 to 0.86054 – longer-term price targets
Bullish confirmation via price action or volume spikes can solidify this outlook.
---
🔴 Bearish Scenario
If price fails to hold the support zone:
A breakdown below 0.10914 invalidates the breakout, indicating a false breakout trap.
Downside targets may include:
0.09000 – local support
0.06500 and 0.03550 – major historical support zones
This scenario would likely reignite bearish momentum.
---
⚠️ Conclusion
GOATUSDT is currently at a critical technical crossroad. The recent breakout and retest could signify a structural trend reversal. If the current support holds, the potential for upside is significant. However, a failure here could lead to deeper correction or consolidation.
---
📌 Key Levels to Watch:
Support: 0.109 – 0.118
Resistance: 0.15745 / 0.21071 / 0.24889 / 0.41017
#GOATUSDT #CryptoBreakout #TechnicalAnalysis #AltcoinSeason #TrendlineBreakout #SupportResistance #FibonacciLevels #SwingTrade #PriceAction #CryptoTA
✅ Get Free Signals! Join Our Telegram Channel Here: t.me/TheCryptoNuclear
✅ Twitter: twitter.com/crypto_nuclear
✅ Join Bybit : partner.bybit.com/b/nuclearvip
✅ Benefits : Lifetime Trading Fee Discount -50%
✅ Twitter: twitter.com/crypto_nuclear
✅ Join Bybit : partner.bybit.com/b/nuclearvip
✅ Benefits : Lifetime Trading Fee Discount -50%
Disclaimer
The information and publications are not meant to be, and do not constitute, financial, investment, trading, or other types of advice or recommendations supplied or endorsed by TradingView. Read more in the Terms of Use.