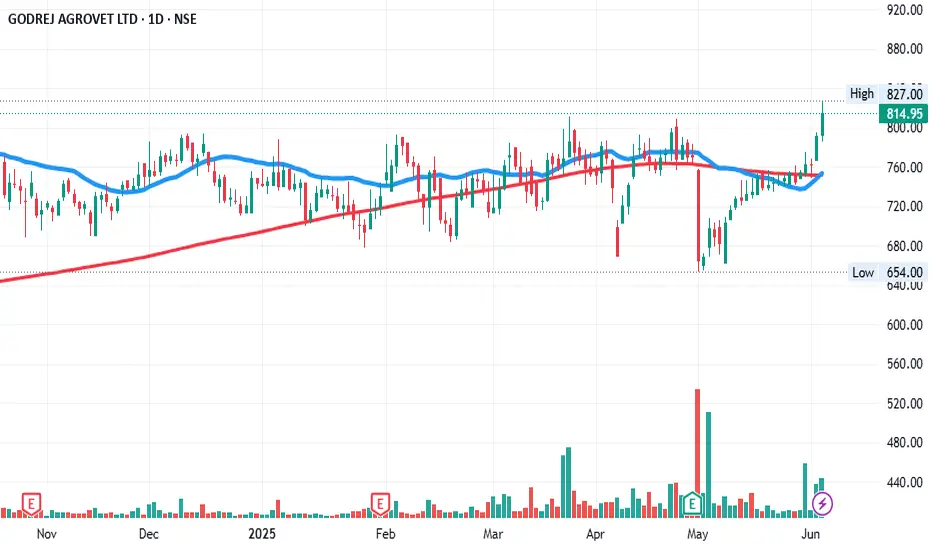
**Structure Insight:**
* **Price:** ₹814.95
* **All-Time High Zone:** \~₹900
* **Current Setup:** Tight **consolidation** near ATH — a **classic bullish base-building pattern**, indicating absorption of supply.
* **Moving Averages:**
* **20 MA (Blue)**: Rising and hugging the price, showing short-term momentum.
* **200 MA (Red)**: Strong uptrend — long-term trend confirmed.
* **Volume:** Noticeable spike during breakout attempts and base formation. **Volume supports accumulation.**
---
🔍 **Multi-Timeframe Confirmation (Daily Chart)**
* **Golden Crossover:** 20 MA > 200 MA
* **Price Action:** Holding above MAs after shakeout – tight range = potential **volatility contraction**.
* **Volume Trend:** Rising on green candles, declining on red = bullish bias.
---
### 🎯 **Trading Plan (Swing / Positional)**
| Element | Details |
| ---------------- | -------------------------------------------- |
| **Buy Zone** | ₹810–₹825 (on breakout or small dip) |
| **Stop Loss** | ₹740 (below consolidation base + MA cluster) |
| **Target 1** | ₹900 (previous ATH) |
| **Target 2** | ₹1,050 (measured move from base) |
| **Risk\:Reward** | \~1:2.5 minimum |
---
### 🛡️ **Risk Management:**
* **Position Size:** Based on 1–2% of capital at risk.
* Avoid chasing — wait for breakout **with volume** or dip near MA confluence.
---
**Pro Trader Insight:**
> “Consolidation near ATH with rising MAs and strong volume = a sign of strength, not exhaustion. Let the market show its hand — enter with precision, not prediction.”
Trade active
CONSOLIDATION GOING ON KEEP HOLDING.Disclaimer
The information and publications are not meant to be, and do not constitute, financial, investment, trading, or other types of advice or recommendations supplied or endorsed by TradingView. Read more in the Terms of Use.
Disclaimer
The information and publications are not meant to be, and do not constitute, financial, investment, trading, or other types of advice or recommendations supplied or endorsed by TradingView. Read more in the Terms of Use.