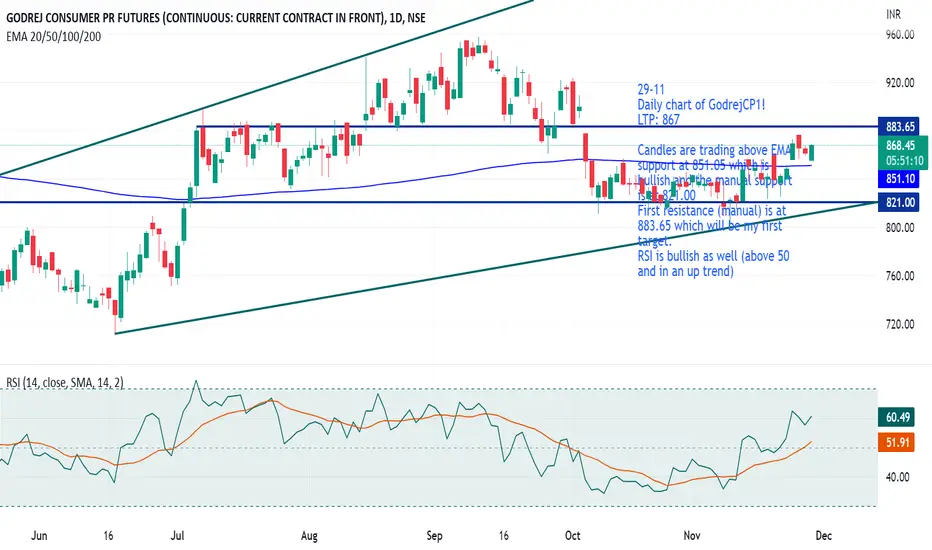
29-11
Daily chart of GodrejCP1!
LTP: 867
Candles are trading above EMA support at 851.05 which is bullish and the manual support is at 821.00
First resistance (manual) is at 883.65 which will be my first target.
RSI is bullish as well (above 50 and in an up trend)
Daily chart of GodrejCP1!
LTP: 867
Candles are trading above EMA support at 851.05 which is bullish and the manual support is at 821.00
First resistance (manual) is at 883.65 which will be my first target.
RSI is bullish as well (above 50 and in an up trend)
Disclaimer
The information and publications are not meant to be, and do not constitute, financial, investment, trading, or other types of advice or recommendations supplied or endorsed by TradingView. Read more in the Terms of Use.
Disclaimer
The information and publications are not meant to be, and do not constitute, financial, investment, trading, or other types of advice or recommendations supplied or endorsed by TradingView. Read more in the Terms of Use.