🚨 Disruption Analysis of the Gold CFD Chart
1. Over-Optimistic Target Placement
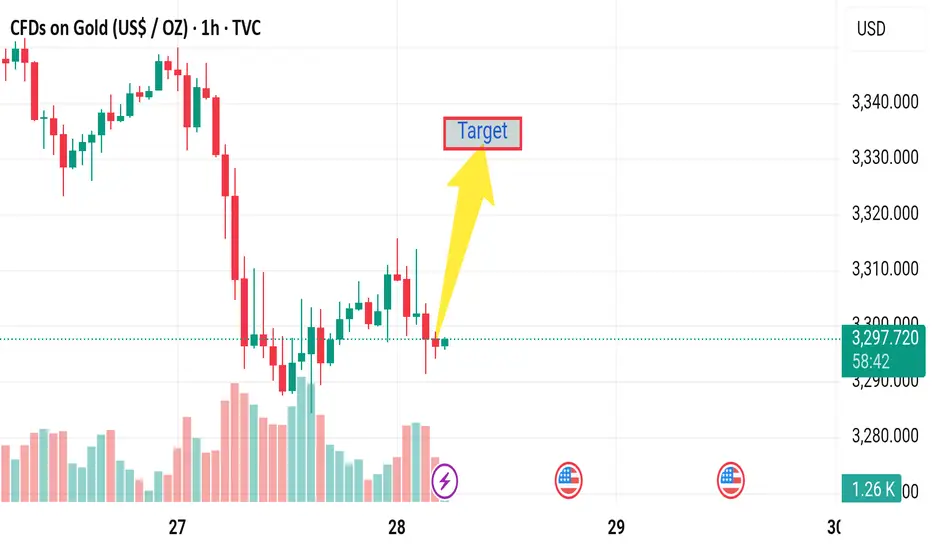
The target is placed significantly above the current market trend without substantial confirmation of a reversal.
The recent bullish candles are weak and not supported by volume spikes.
There's a bearish engulfing pattern forming, suggesting a possible continuation of the downtrend.
2. Weak Volume Confirmation
The rise in price does not coincide with a strong increase in buying volume.
Volume bars are mixed and not clearly favoring buyers, indicating market indecision rather than strength.
3. False Bottom Assumption
The assumption that the market has bottomed on the 27th is speculative.
Without a double-bottom pattern or significant bullish divergence on an RSI/MACD (not shown here), the upward bias is unjustified.
4. Price Action Breakdown
Lower highs and lower lows are still visible.
The short bounce could be a retracement rather than a trend reversal.
5. Macro or Fundamental Events Ignored
Given the presence of the US flag icon (economic event), any upcoming data release (like GDP, interest rates, etc.) could drastically alter market direction.
Trading before news without adjusting targets and stops is risky.
1. Over-Optimistic Target Placement
The target is placed significantly above the current market trend without substantial confirmation of a reversal.
The recent bullish candles are weak and not supported by volume spikes.
There's a bearish engulfing pattern forming, suggesting a possible continuation of the downtrend.
2. Weak Volume Confirmation
The rise in price does not coincide with a strong increase in buying volume.
Volume bars are mixed and not clearly favoring buyers, indicating market indecision rather than strength.
3. False Bottom Assumption
The assumption that the market has bottomed on the 27th is speculative.
Without a double-bottom pattern or significant bullish divergence on an RSI/MACD (not shown here), the upward bias is unjustified.
4. Price Action Breakdown
Lower highs and lower lows are still visible.
The short bounce could be a retracement rather than a trend reversal.
5. Macro or Fundamental Events Ignored
Given the presence of the US flag icon (economic event), any upcoming data release (like GDP, interest rates, etc.) could drastically alter market direction.
Trading before news without adjusting targets and stops is risky.
Disclaimer
The information and publications are not meant to be, and do not constitute, financial, investment, trading, or other types of advice or recommendations supplied or endorsed by TradingView. Read more in the Terms of Use.
Disclaimer
The information and publications are not meant to be, and do not constitute, financial, investment, trading, or other types of advice or recommendations supplied or endorsed by TradingView. Read more in the Terms of Use.