SMC Trading point update
Technical analysis of Gold (XAU/USD) on the 1-hour timeframe, using a combination of trend lines, EMA, RSI, and price structure.
---
Technical Breakdown:
1. Price Structure:
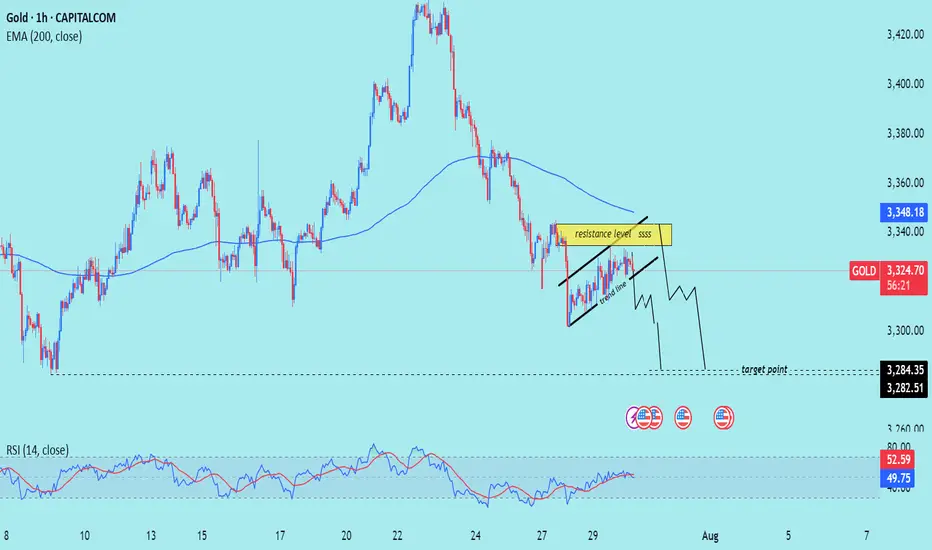
Gold is forming a rising channel (black trend lines) within a short-term uptrend, but this is happening below the 200 EMA, which generally indicates bearish momentum.
A resistance zone is highlighted near the top of the channel, suggesting sellers might defend this level.
2. Key Level:
Resistance Level: Around 3,330–3,335 zone.
Target Point: Price is expected to break down from the channel and reach support levels near 3,284.35 and 3,282.51.
3. Moving Average (EMA 200):
Current price is below the 200 EMA (3,348.42), reinforcing a bearish bias.
4. RSI (14):
RSI is near 52.58, indicating neutral-to-slightly-overbought territory. No strong divergence is visible, but RSI is not confirming a bullish trend either.
5. Projection (Hand-drawn Path):
The drawn path shows a potential breakdown from the channel with a bearish impulse targeting lower support zones.
Mr SMC Trading point
---
Trade Idea Summary:
Bias: Bearish
Confirmation Needed: Break below channel support
Entry Zone: Near the resistance of the rising channel (~3,330–3,335)
Target Zone: 3,284.35 – 3,282.51
Invalidation: Sustained break above 3,348 (above EMA 200)
plesse support boost 🚀 this analysis)
Technical analysis of Gold (XAU/USD) on the 1-hour timeframe, using a combination of trend lines, EMA, RSI, and price structure.
---
Technical Breakdown:
1. Price Structure:
Gold is forming a rising channel (black trend lines) within a short-term uptrend, but this is happening below the 200 EMA, which generally indicates bearish momentum.
A resistance zone is highlighted near the top of the channel, suggesting sellers might defend this level.
2. Key Level:
Resistance Level: Around 3,330–3,335 zone.
Target Point: Price is expected to break down from the channel and reach support levels near 3,284.35 and 3,282.51.
3. Moving Average (EMA 200):
Current price is below the 200 EMA (3,348.42), reinforcing a bearish bias.
4. RSI (14):
RSI is near 52.58, indicating neutral-to-slightly-overbought territory. No strong divergence is visible, but RSI is not confirming a bullish trend either.
5. Projection (Hand-drawn Path):
The drawn path shows a potential breakdown from the channel with a bearish impulse targeting lower support zones.
Mr SMC Trading point
---
Trade Idea Summary:
Bias: Bearish
Confirmation Needed: Break below channel support
Entry Zone: Near the resistance of the rising channel (~3,330–3,335)
Target Zone: 3,284.35 – 3,282.51
Invalidation: Sustained break above 3,348 (above EMA 200)
plesse support boost 🚀 this analysis)
(Services:✔️ JOIN Telegram channel
t.me/SMCTrading_point
Gold trading signals 🚀 99%
t.me/SMCTrading_point
Join my recommended broker , link 👇
World best broker exness ✅D
one.exnesstrack.org/a/l1t1rf3p6v
t.me/SMCTrading_point
Gold trading signals 🚀 99%
t.me/SMCTrading_point
Join my recommended broker , link 👇
World best broker exness ✅D
one.exnesstrack.org/a/l1t1rf3p6v
Related publications
Disclaimer
The information and publications are not meant to be, and do not constitute, financial, investment, trading, or other types of advice or recommendations supplied or endorsed by TradingView. Read more in the Terms of Use.