https://tradingview.sweetlogin.com/x/G7RfP9aJ/
💡Message Strategy
The gold market is facing a complex game of long and short factors in the near future. On the one hand, US President Trump announced that Iran and Israel had reached a "comprehensive ceasefire", and the market's risk aversion demand plummeted, and gold was under obvious short-term pressure. However, according to Reuters, Israel still has small-scale military operations, which has led to differences in the market's optimism about the situation in the Middle East, and the downward space of gold is temporarily limited.
On the other hand, US economic data is mixed. In June, the S&P global manufacturing PMI remained unchanged at 52, the service industry PMI fell slightly to 53.1, and the composite PMI fell slightly to 52.8, suggesting that the momentum of economic expansion has slowed down marginally. More importantly, Fed officials have released dovish signals one after another. Fed Governor Bowman expressed concern about labor market risks and supported interest rate cuts this year, echoing Governor Waller's expectations of a rate cut in July. This adjustment in monetary policy expectations has led to a weakening of the US dollar, providing some support for gold prices.
📊Technical aspects
1. Pay attention to the defensive position at the weekly level. As time goes by, this position is now in the 3316-3315 area. After breaking 3333 at noon, it accelerated to reach here, so pay attention to the gains and losses here in the future, so as to prepare for the next space switch
2. The daily line has been defending the lifeline for nearly a month. The current lifeline position is 3355. No matter how it pierces in the previous process, the final closing line must return to the top of the lifeline, thus becoming a support area
This means that today's closing is very critical. It can be closed below the lifeline, and then switch space downward to enter the area from the lifeline to the lower track 3355-3280
3. The four-hour pattern opens downward. Yesterday, the resistance of the upper track of the pattern was determined twice, and then it began to fall continuously, fell back to the lifeline, and then fell below the lower track of the pattern. Now it is further down and breaking the low
Then, keeping high is the key, breaking low is the focus. The previous starting and falling acceleration points are 3357 area, 3370, and finally 3388-3390.
Today's high point is 3370 area. The resistance range of 3357 is determined at noon. The pattern opens downward. Keep high and break low to see acceleration. After breaking the high point, it returns to sweeping.
4. The double lines of the hourly chart are glued together to form a pressure area. The interval of 3355-3370 just coincides with the two resistances above. Use this as suppression to switch space downward.
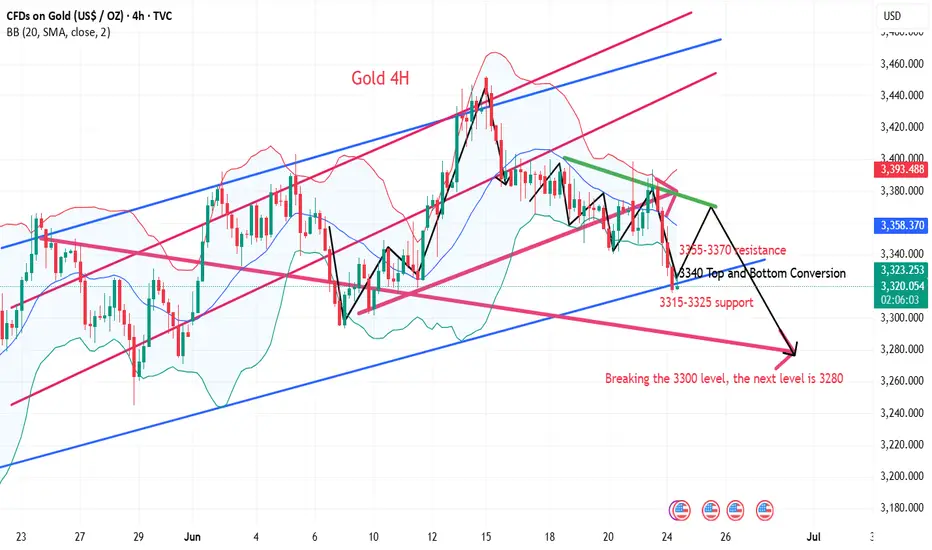
5. The large channel cooperates with the small channel. The price falls below the lower track position of the large channel and begins to switch space further downward. The top and bottom conversion position is 3340, and the final acceleration starting point is 3348.
Use this as suppression, and look down to the weekly defense line area of 3316-3315.
If it falls below, the next support will focus on the 3300 mark. If it breaks 3300 again, the next position is 3280
💰Strategy Package
Short Position:3348-3354,SL:3375,Target: 3300-3310
Long Position:3280-3290,SL:3260,Target: 3340
💡Message Strategy
The gold market is facing a complex game of long and short factors in the near future. On the one hand, US President Trump announced that Iran and Israel had reached a "comprehensive ceasefire", and the market's risk aversion demand plummeted, and gold was under obvious short-term pressure. However, according to Reuters, Israel still has small-scale military operations, which has led to differences in the market's optimism about the situation in the Middle East, and the downward space of gold is temporarily limited.
On the other hand, US economic data is mixed. In June, the S&P global manufacturing PMI remained unchanged at 52, the service industry PMI fell slightly to 53.1, and the composite PMI fell slightly to 52.8, suggesting that the momentum of economic expansion has slowed down marginally. More importantly, Fed officials have released dovish signals one after another. Fed Governor Bowman expressed concern about labor market risks and supported interest rate cuts this year, echoing Governor Waller's expectations of a rate cut in July. This adjustment in monetary policy expectations has led to a weakening of the US dollar, providing some support for gold prices.
📊Technical aspects
1. Pay attention to the defensive position at the weekly level. As time goes by, this position is now in the 3316-3315 area. After breaking 3333 at noon, it accelerated to reach here, so pay attention to the gains and losses here in the future, so as to prepare for the next space switch
2. The daily line has been defending the lifeline for nearly a month. The current lifeline position is 3355. No matter how it pierces in the previous process, the final closing line must return to the top of the lifeline, thus becoming a support area
This means that today's closing is very critical. It can be closed below the lifeline, and then switch space downward to enter the area from the lifeline to the lower track 3355-3280
3. The four-hour pattern opens downward. Yesterday, the resistance of the upper track of the pattern was determined twice, and then it began to fall continuously, fell back to the lifeline, and then fell below the lower track of the pattern. Now it is further down and breaking the low
Then, keeping high is the key, breaking low is the focus. The previous starting and falling acceleration points are 3357 area, 3370, and finally 3388-3390.
Today's high point is 3370 area. The resistance range of 3357 is determined at noon. The pattern opens downward. Keep high and break low to see acceleration. After breaking the high point, it returns to sweeping.
4. The double lines of the hourly chart are glued together to form a pressure area. The interval of 3355-3370 just coincides with the two resistances above. Use this as suppression to switch space downward.
5. The large channel cooperates with the small channel. The price falls below the lower track position of the large channel and begins to switch space further downward. The top and bottom conversion position is 3340, and the final acceleration starting point is 3348.
Use this as suppression, and look down to the weekly defense line area of 3316-3315.
If it falls below, the next support will focus on the 3300 mark. If it breaks 3300 again, the next position is 3280
💰Strategy Package
Short Position:3348-3354,SL:3375,Target: 3300-3310
Long Position:3280-3290,SL:3260,Target: 3340
Trade active
The Fed is becoming more dovish. Will gold bulls take advantage of the situation? Pay attention to Powell's testimonyThrough scientific and rigorous financial analysis and personalized strategy formulation, we help you achieve stable growth of wealth. At the same time, in a complex and changing economic environment, we help you avoid potential risks and protect the saf
Disclaimer
The information and publications are not meant to be, and do not constitute, financial, investment, trading, or other types of advice or recommendations supplied or endorsed by TradingView. Read more in the Terms of Use.
Through scientific and rigorous financial analysis and personalized strategy formulation, we help you achieve stable growth of wealth. At the same time, in a complex and changing economic environment, we help you avoid potential risks and protect the saf
Disclaimer
The information and publications are not meant to be, and do not constitute, financial, investment, trading, or other types of advice or recommendations supplied or endorsed by TradingView. Read more in the Terms of Use.