https://tradingview.sweetlogin.com/x/Io2OPbLN/
Last week saw a generally volatile rally, with rising lows and higher highs. However, each breakout was followed by a rapid decline. If the decline failed to break the previous low, the market would continue to rise and break the previous high.
This meant a rise of around $40, followed by a $20-30 correction.
The second half of the week saw repeated testing of the 3405 area, with rapid declines following the breakout, keeping the correction within a $30 range.
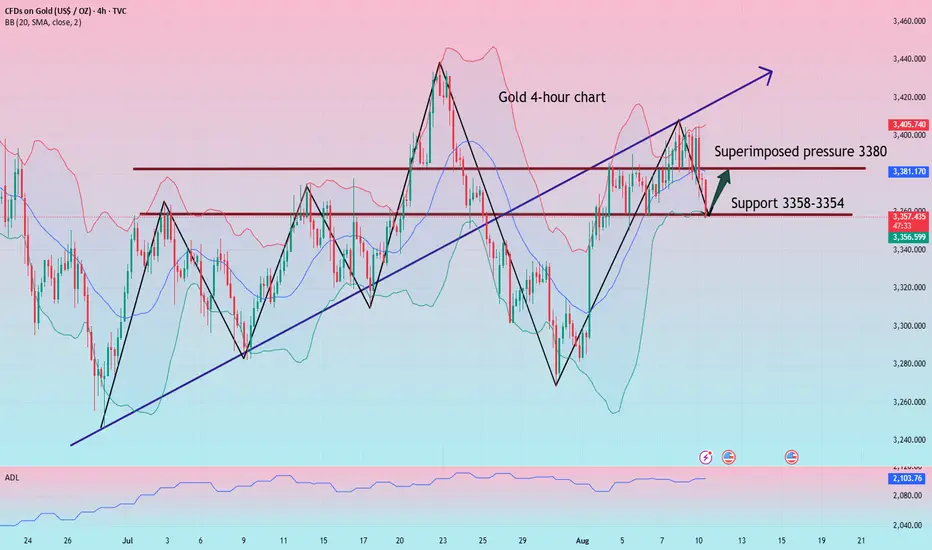
However, today, Monday, this rhythm was disrupted. Due to the US's frenzy, the price immediately declined after hitting 3405 in early trading, breaking below the 3380 area, which was repeatedly tested last Friday. This area is also the upper limit of the purple channel line and the double line on the hourly chart.
It further declined to the 3367 area, where it experienced a rapid rise and repeatedly tested the 3380-3380 range. 2. Support and Resistance Switching Positions
Before the European session, the decline continued, reaching the 3357-3356 level, expanding the scope of the sweep and the strength of the decline.
At this point, the entire price has returned to the double-line range on the hourly chart.
This brings us to the recent cycle points. The rhythm shift is a two-step process: the first step is a return to the double-line range, and the second step is a breakout of the double-line range.
The first step is now a return to the double-line range, with the upper band at 3380-3382 and the lower band at 3358-3354, where multiple supports are present.
For now, we will focus on the upper and lower bands of this double-line range. We will then focus on the second step of the breakout, switching between spaces and shifting the rhythm.
To elaborate:
1. Rhythm Switching Point: The first step is a return to the double-line range, and the second step is a breakout of the double line. Range
Now we've returned to the double-line range, with resistance at 3380-3382 and support at 3358-3354.
2. The daily chart remains in the range from the lifeline to the upper band. The lifeline at 3356 coincides with the upper double-line lower band, while upper band resistance lies at 3432.
3. The four-hour chart has flattened, showing a sweeping pattern. The lifeline is at 3382, and the lower band and the double-line lower band coincide at 3358-3356. This coincides with the double-line on the hourly chart.
This also corresponds to a shift in space and rhythm:
First, a downward breakout occurs. The four-hour chart opens, and the price breaks below the double-line on the hourly chart, turning it into resistance and guiding a downward trend.
Second, an upward breakout occurs. The four-hour chart breaks through the lifeline, breaking through the double-line on the hourly chart, and moving upward. Switching space, watch the 3405 area upwards. Repeatedly test this area, focusing on this area first. Once it breaks through, then look for a switch.
Thus, for gold today, after a sharp drop at the opening, it entered a dual-line range. During the European trading session, the price fluctuated around this dual-line range. Tentatively, this sweep within the dual-line range will see resistance at 3380-3382 and support at 3358-3356.
Watch for a sweep within this range. Once the price breaks through, look for further switching. Using the principle of equal distance profit margins, consider a halving of approximately $25.
Based on this approach, go long in the 3358-3354 area. Those already in the market should continue holding, with a stop-loss near 3348. The target is 3372, followed by 3380-3382. A breakout will switch space.
Last week saw a generally volatile rally, with rising lows and higher highs. However, each breakout was followed by a rapid decline. If the decline failed to break the previous low, the market would continue to rise and break the previous high.
This meant a rise of around $40, followed by a $20-30 correction.
The second half of the week saw repeated testing of the 3405 area, with rapid declines following the breakout, keeping the correction within a $30 range.
However, today, Monday, this rhythm was disrupted. Due to the US's frenzy, the price immediately declined after hitting 3405 in early trading, breaking below the 3380 area, which was repeatedly tested last Friday. This area is also the upper limit of the purple channel line and the double line on the hourly chart.
It further declined to the 3367 area, where it experienced a rapid rise and repeatedly tested the 3380-3380 range. 2. Support and Resistance Switching Positions
Before the European session, the decline continued, reaching the 3357-3356 level, expanding the scope of the sweep and the strength of the decline.
At this point, the entire price has returned to the double-line range on the hourly chart.
This brings us to the recent cycle points. The rhythm shift is a two-step process: the first step is a return to the double-line range, and the second step is a breakout of the double-line range.
The first step is now a return to the double-line range, with the upper band at 3380-3382 and the lower band at 3358-3354, where multiple supports are present.
For now, we will focus on the upper and lower bands of this double-line range. We will then focus on the second step of the breakout, switching between spaces and shifting the rhythm.
To elaborate:
1. Rhythm Switching Point: The first step is a return to the double-line range, and the second step is a breakout of the double line. Range
Now we've returned to the double-line range, with resistance at 3380-3382 and support at 3358-3354.
2. The daily chart remains in the range from the lifeline to the upper band. The lifeline at 3356 coincides with the upper double-line lower band, while upper band resistance lies at 3432.
3. The four-hour chart has flattened, showing a sweeping pattern. The lifeline is at 3382, and the lower band and the double-line lower band coincide at 3358-3356. This coincides with the double-line on the hourly chart.
This also corresponds to a shift in space and rhythm:
First, a downward breakout occurs. The four-hour chart opens, and the price breaks below the double-line on the hourly chart, turning it into resistance and guiding a downward trend.
Second, an upward breakout occurs. The four-hour chart breaks through the lifeline, breaking through the double-line on the hourly chart, and moving upward. Switching space, watch the 3405 area upwards. Repeatedly test this area, focusing on this area first. Once it breaks through, then look for a switch.
Thus, for gold today, after a sharp drop at the opening, it entered a dual-line range. During the European trading session, the price fluctuated around this dual-line range. Tentatively, this sweep within the dual-line range will see resistance at 3380-3382 and support at 3358-3356.
Watch for a sweep within this range. Once the price breaks through, look for further switching. Using the principle of equal distance profit margins, consider a halving of approximately $25.
Based on this approach, go long in the 3358-3354 area. Those already in the market should continue holding, with a stop-loss near 3348. The target is 3372, followed by 3380-3382. A breakout will switch space.
Trade active
Gold started to rise and our profits became clear.Trade closed: target reached
Continue to wait for the data to reach the target locationHey, everyone. I'm Yulia, a girl from Russia working as an analyst in New York, USA. I've been doing this job for 13 years. I have professional financial knowledge. I hope you like me.
Related publications
Disclaimer
The information and publications are not meant to be, and do not constitute, financial, investment, trading, or other types of advice or recommendations supplied or endorsed by TradingView. Read more in the Terms of Use.
Hey, everyone. I'm Yulia, a girl from Russia working as an analyst in New York, USA. I've been doing this job for 13 years. I have professional financial knowledge. I hope you like me.
Related publications
Disclaimer
The information and publications are not meant to be, and do not constitute, financial, investment, trading, or other types of advice or recommendations supplied or endorsed by TradingView. Read more in the Terms of Use.